This article is also available in Spanish.
Ethereum is trading at a critical demand level after an 11% pullback from recent local highs. This drop worries analysts and investors, as losing this level could trigger a wave of aggressive selling, potentially leading to a decline in ETH prices.
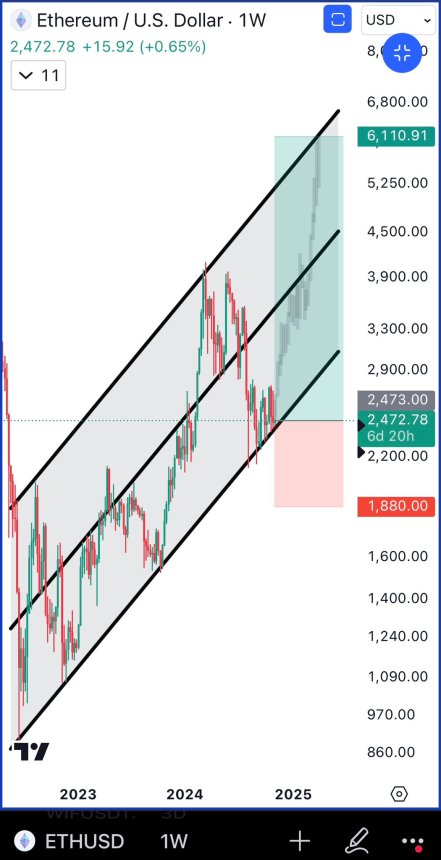
However, amid this concern, prominent analyst Ali Martinez shared an optimistic technical analysis, highlighting a strong risk-reward setup on the Ethereum chart. According to Martinez, the current level offers a compelling entry point, suggesting that Ethereum could see significant upside if it maintains support.
Related reading
The timing of this potential rebound is particularly noteworthy with tomorrow’s US elections, an event that could strongly influence overall market sentiment. Many in the crypto community expect the election results to set the stage for a new rally, with Ethereum positioned to capitalize if bullish momentum returns.
In the coming days, all eyes will be on ETH’s ability to defend this demand zone, as its performance could validate or challenge prevailing bullish expectations in the market. For now, Ethereum’s price level remains crucial, and the market is closely watching for signs of direction amid elections and broader economic uncertainties.
Can Ethereum Stay Above Key Demand?
Ethereum is trading at a crucial support level around $2,450, which many analysts view as a critical “last line of defense” for bulls. Ethereum could see a larger decline if this level fails, which could put it at risk of underperformance compared to competitors like Solana or Bitcoin, which have recently demonstrated greater relative strength.
Investors share this concern and are closely monitoring ETH’s developments as it approaches this crucial support.
However, leading crypto analyst Ali Martinez offered a more bullish outlook on X, suggesting that Ethereum could be poised for a significant recovery. In his recent technical analysis, Martinez highlighted that ETH’s current risk/reward ratio is very attractive for a long position, especially for those with a longer-term outlook.

He revealed that he had set a stop-loss below $1,880 – a level limiting downside risk – while targeting an ambitious price of $6,000. This target represents a potential upside of 145% from current prices, underscoring Martinez’s confidence in Ethereum’s upside potential if it can hold on to this crucial area.
The next few days, if not hours, could prove decisive for Ethereum as it consolidates at $2,450. To achieve Martinez’s goal, ETH must strengthen and start challenging local highs, signaling that buyers are stepping in.
Related reading
Future price action will reveal whether Ethereum can reignite its bullish momentum or succumb to further downward pressure. For now, the $2,450 support serves as a critical threshold for ETH’s near-term trajectory.
ETH technical analysis
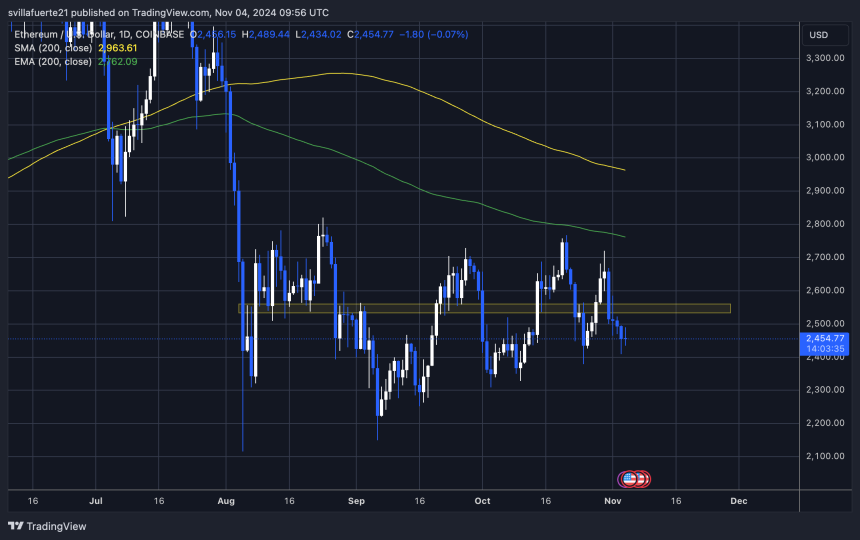
Ethereum (ETH) is trading at $2,450 after a strong rebound following a failed breakdown below the $2,400 mark. This resilience is encouraging for bulls who believe ETH is poised for a significant rally, especially if Bitcoin can surpass its all-time high.
However, this crucial support level alone is not enough to trigger a lasting uptrend. Bulls need to push the price above the 200-day exponential moving average (EMA), currently at $2,762, to confirm their momentum and establish a stronger bullish outlook.

The 200-day EMA has acted as formidable resistance since early August, driving the price of ETH down several times. A break above this moving average would indicate a critical shift, potentially turning it into a new support level. The move would pave the way for ETH to challenge higher levels, fueled by renewed buyer confidence and broader market optimism.
Related reading
Conversely, if bulls fail to reclaim this EMA, Ethereum could face continued downward pressure, leading to further testing of key supports. For now, ETH support around $2,450 maintains hope for bulls aiming for a breakout, but reclaiming the 200-day EMA remains key to fueling the next leg of a bull rally.
Featured image of Dall-E, chart by TradingView


