


- Ethereum hit a three-month high above $2,900 as bullish sentiment strengthens.
- The increase in the estimated leverage ratio and funding rates portends increasing speculative activity by derivatives traders.
Ethereum (ETH) gained 20% in just two days, with the price hovering between $2,400 and $2,950. At press time, ETH was trading at $2,922, its highest level in over three months.
Recent gains have been accompanied by increasing volatility. In fact, the estimated leverage ratio increased significantly this week to its highest level in seven days.
At press time, this measurement stood at 0.42. This shows that 42% of open positions in the derivatives market are backed by leverage. Increased leverage activity tends to increase price volatility.
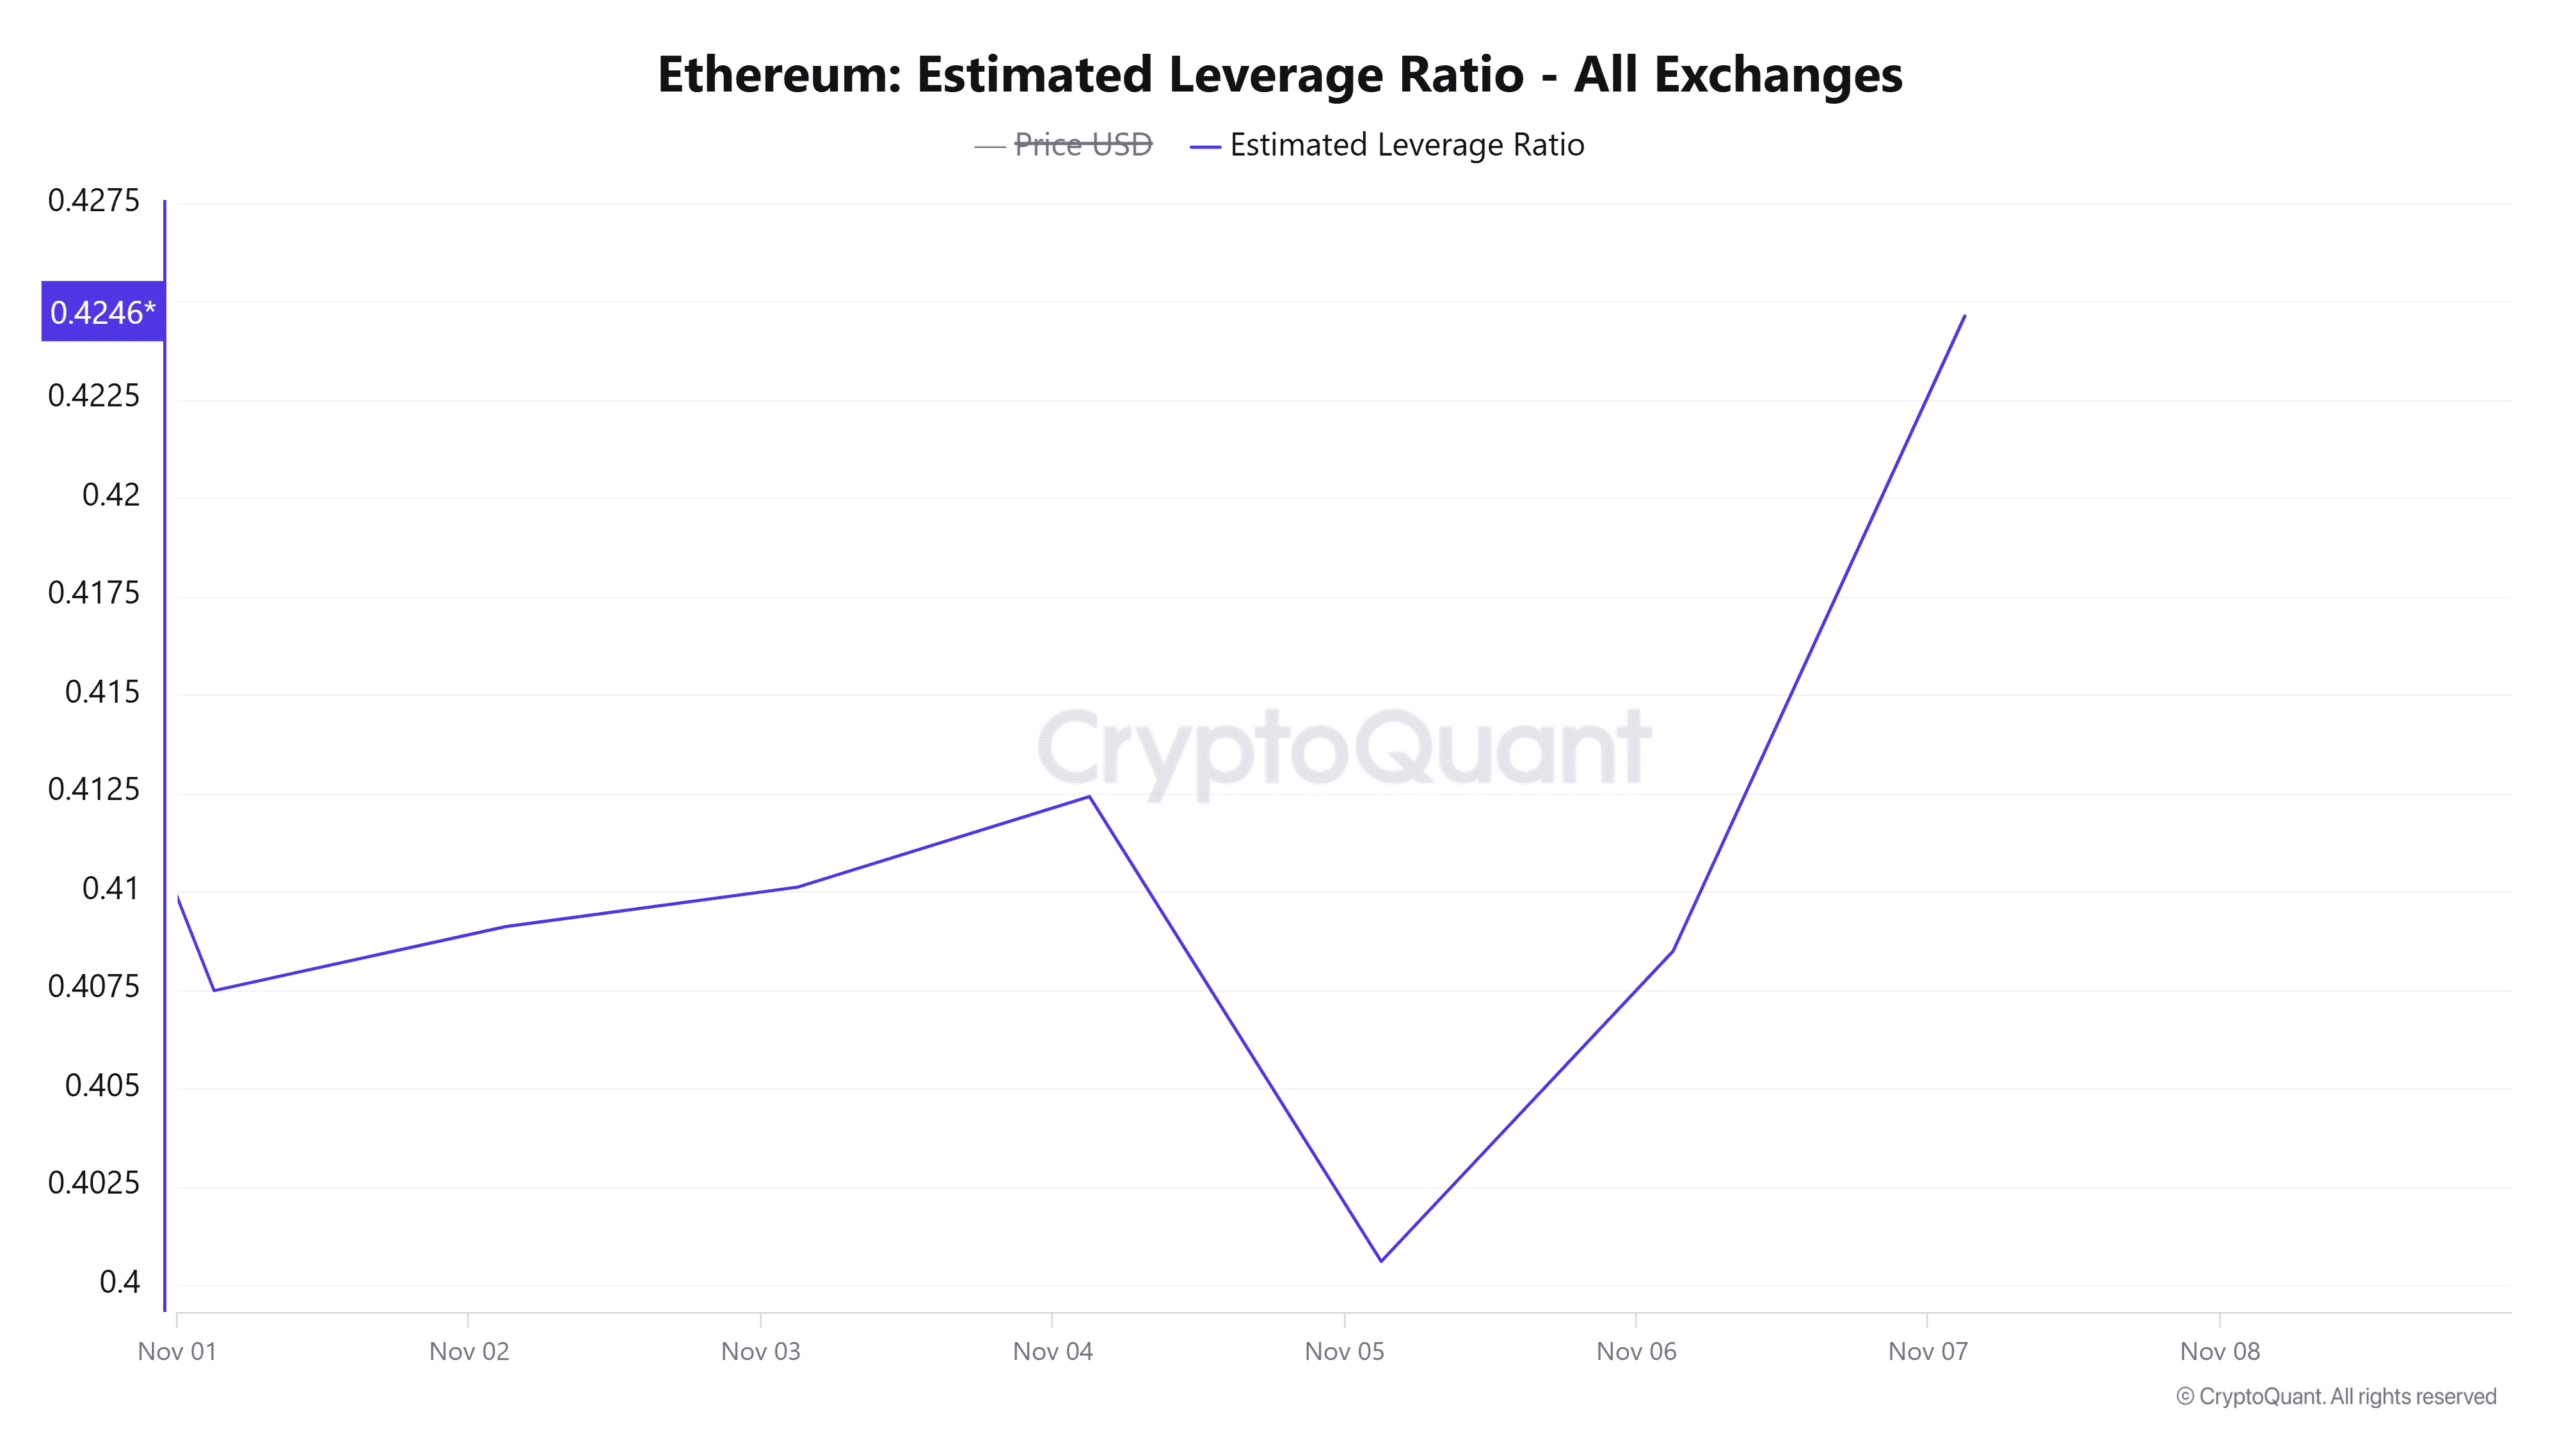
Source: CryptoQuant
However, the estimated leverage ratio has not yet reached extreme levels, giving Ethereum room to continue its uptrend.
Funding Rates and Open Interest Hit Multi-Month Highs
Newly opened positions in the derivatives market appear long. This can be seen in the rise in financing rates which have reached their highest level in three months.
When funding rates rise, it shows an influx of long positions. This also indicates that long traders are willing to pay higher fees to maintain their positions, further suggesting that there is a bullish bias in the market.
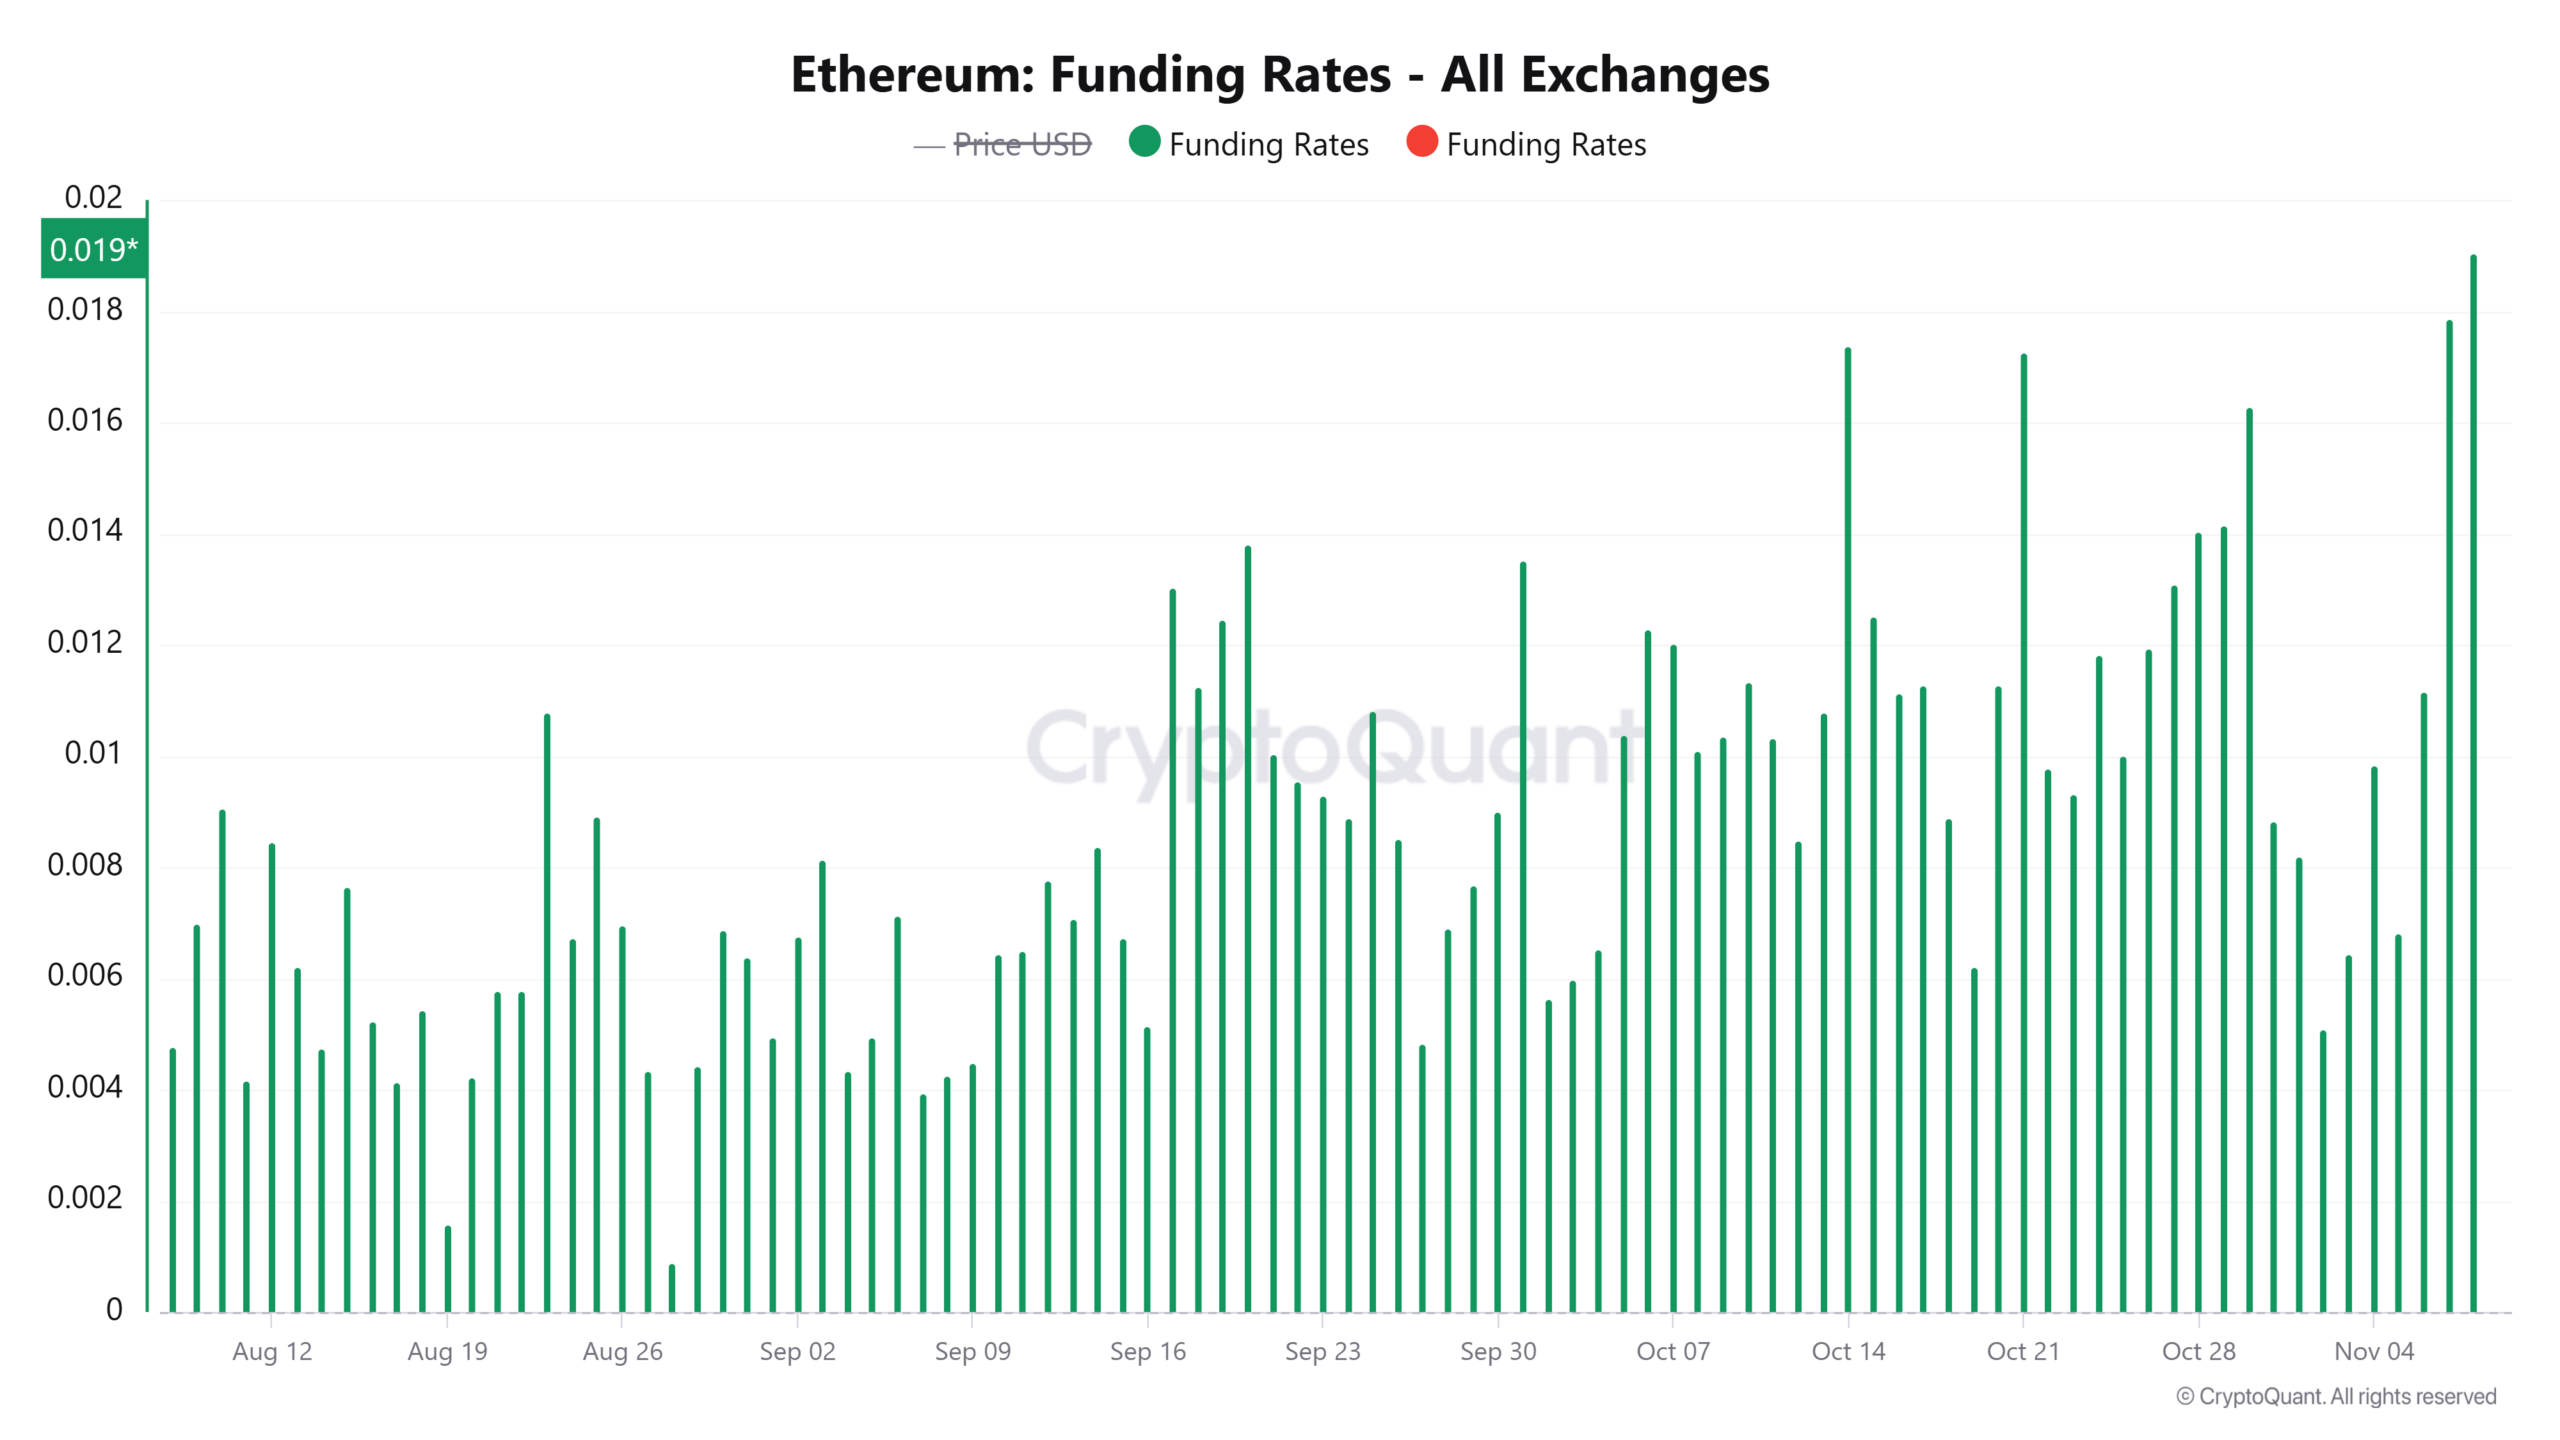
Source: CryptoQuant
At the same time, Ethereum open interest continues to rise and, at press time, reached a five-month high of $16.61 billion annually. coin mechanism data.
Over the past two days, Ethereum open interest has increased by over $3 billion, further showing that speculative interest in ETH is high.
Increased trading activity and open positions in the derivatives market increase the likelihood of high volatility. This could also indicate that ETH could be on the verge of an overheated market.
However, technical indicators suggest that a bull run for ETH could also be underway.
Ethereum tests 200-day moving average
Ethereum is currently testing crucial resistance at the 200-day simple moving average (SMA) on its one-day chart. If ETH manages to break this price level down to $2,955, it could lead to a sustained uptrend.
Reversing this resistance could also pave the way for a 12% rally to the 1.618 Fibonacci level ($3,260).
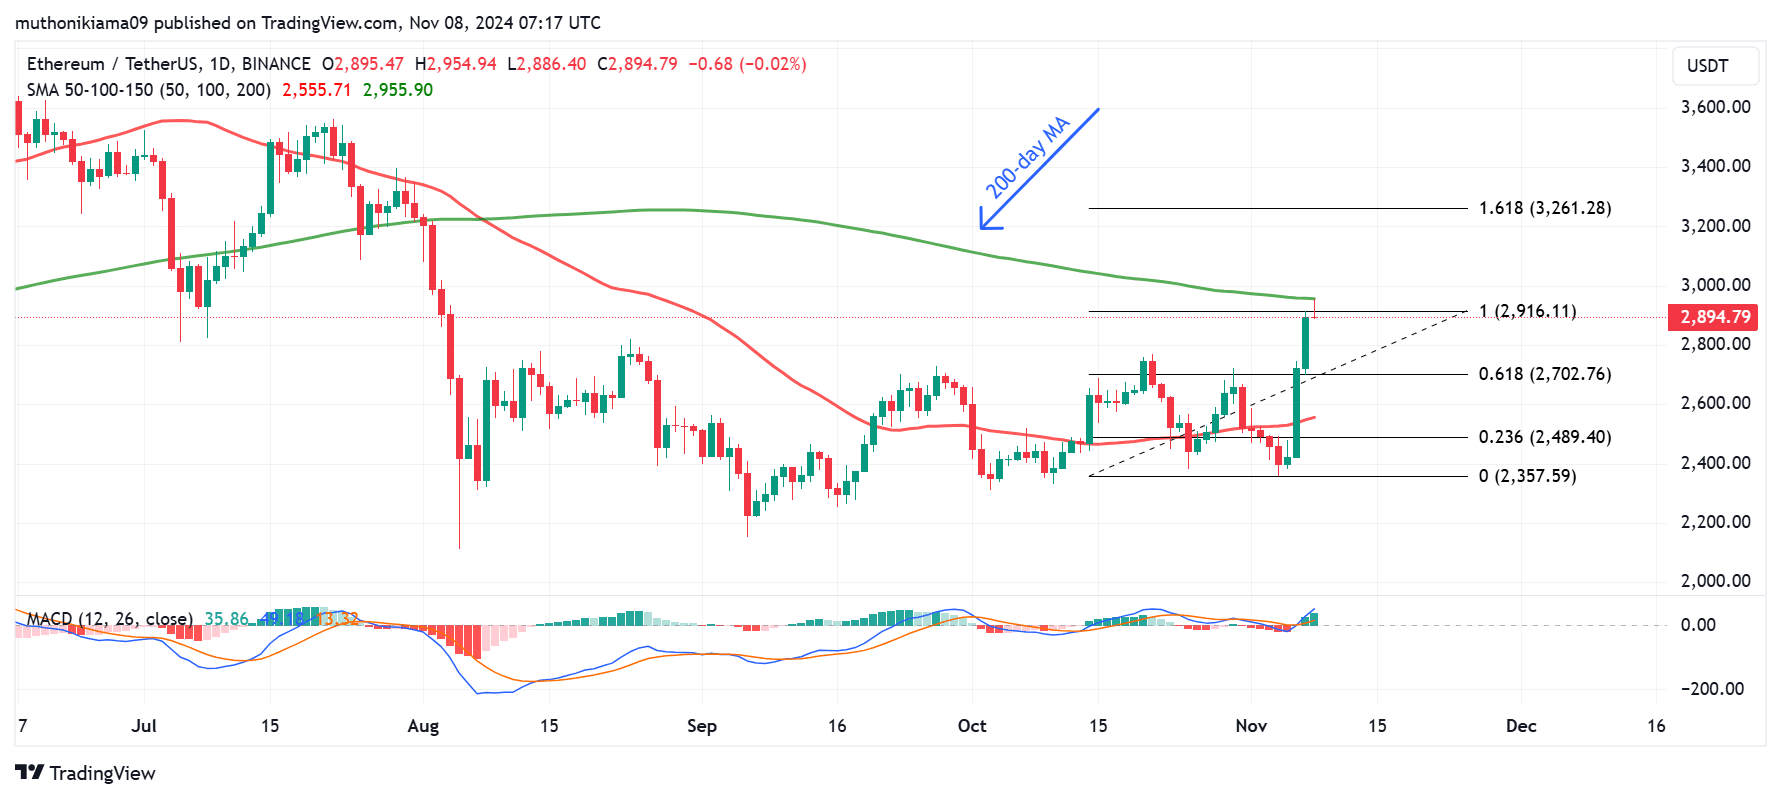
Source: Tradingview
The Moving Average Convergence Divergence (MACD) suggests more gains are to come. This metric turned positive and also made a sharp move northward, showing that the uptrend is strengthening.
However, traders should watch out for signs of profit-taking as selling pressure could push prices lower to test support at $2,700. A fall below this support could trigger a downtrend.
Are inflows into ETH ETFs driving the rally?
On November 7, total inflows to spot Ethereum exchange-traded funds (ETFs) reached $79.74 million, their highest level since August according to SoSoValue.
The Fidelity Ethereum Fund ETF (FETH) saw the highest inflows of $28 million, followed by the BlackRock iShares Ethereum Trust with inflows of $23 million.
Read Ethereum (ETH) Price Forecast 2024-2025
The VanEck Ethereum Trust also saw inflows of $12 million, marking its first inflows in two weeks.
If demand for ETH ETFs continues, this could bode well for the price of Ethereum.