Close Menu
Altcoin ObserverAltcoin Observer
  • Regulation
  • Bitcoin
  • Altcoins
  • Market
  • Analysis
  • DeFi
  • Security
  • Ethereum
Categories
  • Altcoins (2,875)
  • Analysis (3,014)
  • Bitcoin (3,624)
  • Blockchain (2,157)
  • DeFi (2,619)
  • Ethereum (2,469)
  • Event (104)
  • Exclusive Deep Dive (1)
  • Landscape Ads (2)
  • Market (2,708)
  • Press Releases (11)
  • Reddit (2,304)
  • Regulation (2,461)
  • Security (3,484)
  • Thought Leadership (3)
  • Uncategorized (2)
  • Videos (43)
Hand picked
  • First Time?
  • Ethereum Strawmap: Can ETH Become the “High-Speed ​​Internet of Value”?
  • $1.8 Billion in 60 Minutes: How War Headlines Sparked a Historic Leverage Purge
  • Ripple publishes white paper on institutional framework for trading digital assets
  • Polymarket Says 70% Chance A MoltBook AI Agent Sues A Human
We are social
  • Facebook
  • Twitter
  • Instagram
  • YouTube
Facebook X (Twitter) Instagram
  • About us
  • Disclaimer
  • Terms of service
  • Privacy policy
  • Contact us
Facebook X (Twitter) Instagram YouTube LinkedIn
Altcoin ObserverAltcoin Observer
  • Regulation
  • Bitcoin
  • Altcoins
  • Market
  • Analysis
  • DeFi
  • Security
  • Ethereum
Events
Altcoin ObserverAltcoin Observer
Home»Altcoins»Polygon Bull Flag Emerges as Activity Declines: Should Buyers Be Cautious?
Altcoins

Polygon Bull Flag Emerges as Activity Declines: Should Buyers Be Cautious?

December 13, 2024No Comments
Share Facebook Twitter Pinterest LinkedIn Tumblr Reddit Telegram Email
Editors 2 1000x600.jpg
Share
Facebook Twitter LinkedIn Pinterest Email


  • POL appears to have formed a bull flag on its four-hour chart, suggesting an uptrend ahead.
  • This uptrend may face resistance given that a majority of holders have not yet become profitable.

Polygon (POL) was trading at $0.655 at press time, following an 11% gain in 24 hours. These gains represent a reversal of downtrends, given that the price remained down 7% over the past seven days.

Polygon, like most altcoins, saw a strong uptrend in late November, before hitting a snag earlier this month. This uptrend and the subsequent decline formed a bull flag on the four-hour chart of POL.

This trend suggests that POL could continue its uptrend, but more buying volume is needed to support a breakout.
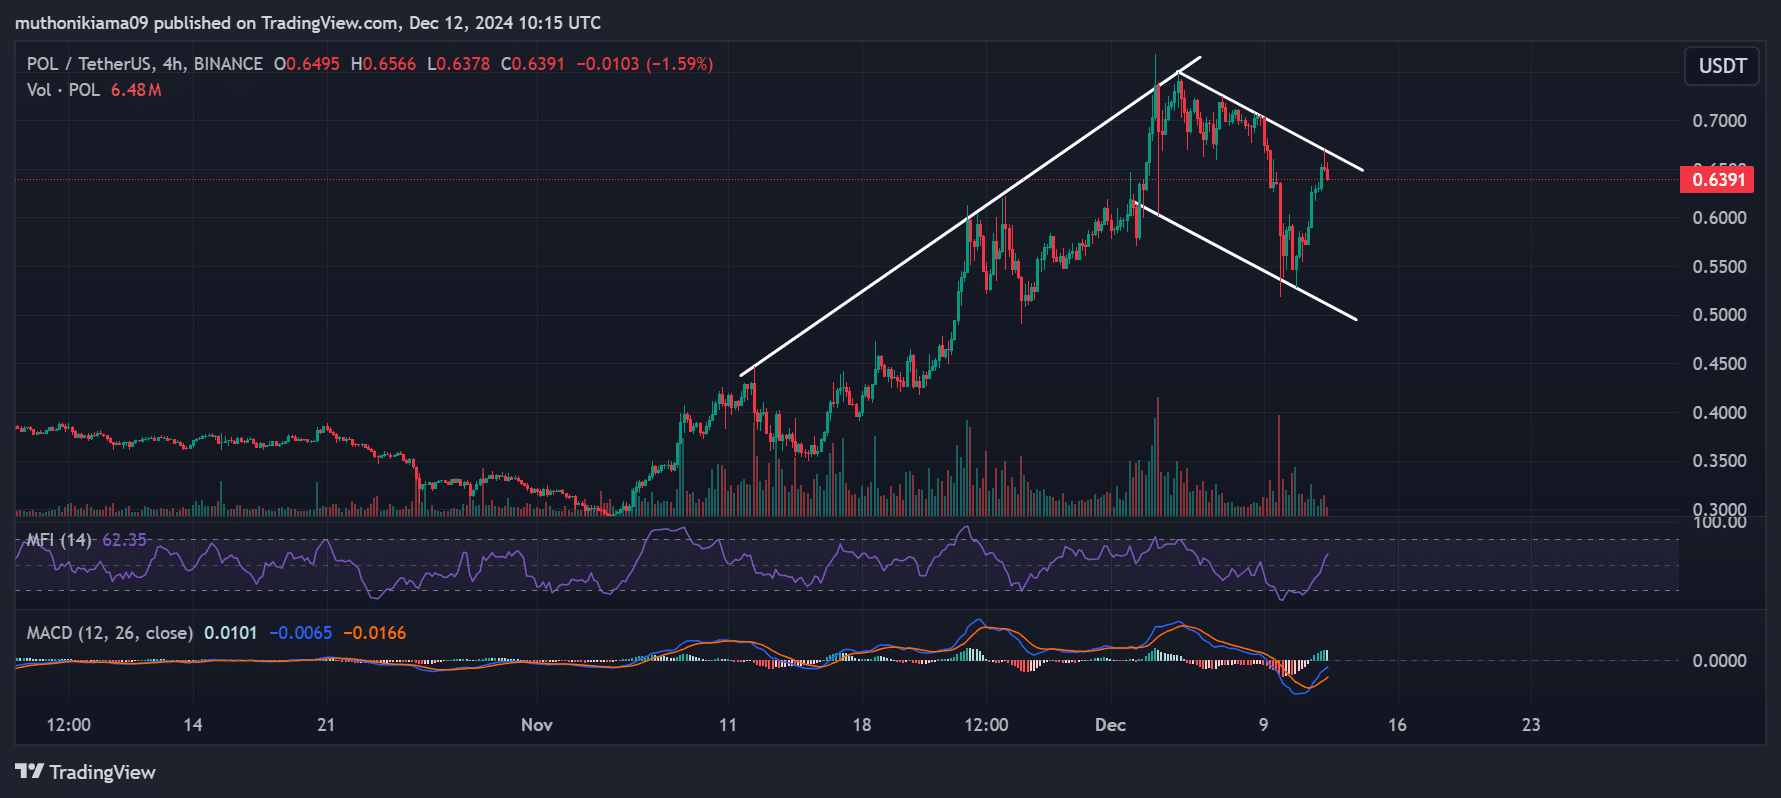
Source: Tradingview

The volume histogram bars represent minimal buying and selling activity. However, the Money Flow Index (MFI) suggests buying activity is increasing after rising to 62.

The Moving Average Convergence Divergence (MACD) also shows the bulls regaining control after the MACD histogram bars turned green, an indication of increasing buying activity.

At the same time, the MACD line on this lower time frame is in an uptrend, and if it rises above the signal line, it will be a confirmation of a short-term uptrend.

Key levels to watch

IntoTheBlock’s In/Out of the Money Around Price (IOMAP) metric shows that nearly 10,000 addresses purchased POL between $0.65 and $0.67. This price zone could act as a support level, with a decline below likely to cause a downturn.

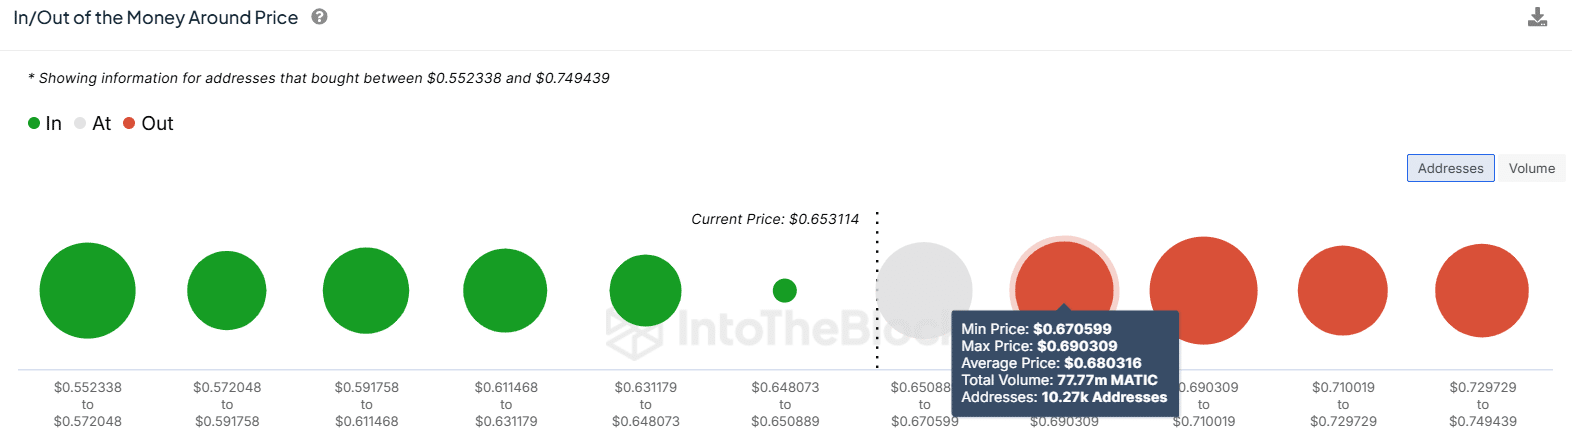
Source: In the block

The other cohort to watch is the 10,270 addresses that purchased over 31 million POL tokens between $0.67 and $0.69. This area could act as a strong resistance level since these addresses could start selling off once they become profitable.

Polygon’s dApp business could impact price

Data from DappRadar shows a notable drop of more than 8% in Polygon’s seven-day dApp volumes, which stood at $2.41 billion at press time. Unique active wallets (UAWs) also fell 10%.
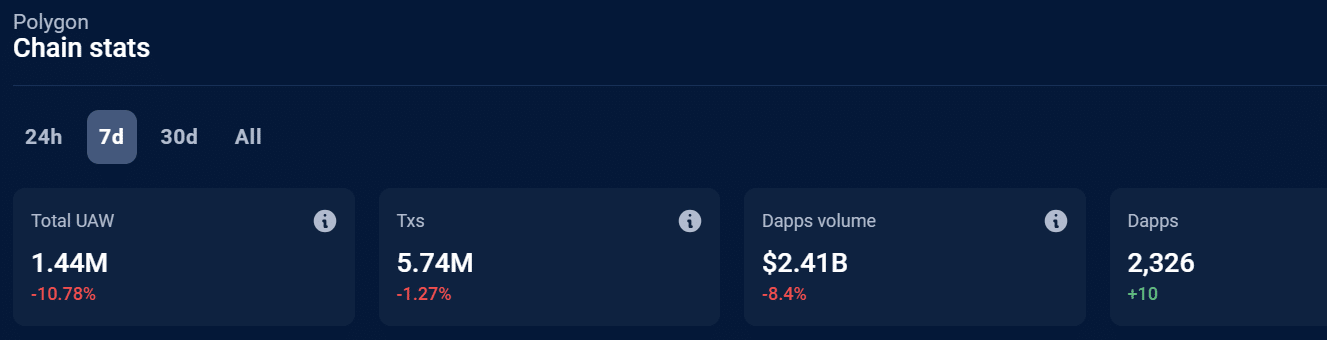
Source: DappRadar

However, on the decentralized finance (DeFi) front, Polygon has seen a strong recovery, with total value locked (TVL) reaching $1.195 billion annually. DeFiLlama. The TVL is now at its highest level in over a month.

If the Polygon network continues to show strength and growth, this could bode well for POL.


Is your wallet green? Check out the POL profit calculator


Long/Short Ratio Shows Shift in Sentiment

Polygon’s long/short ratio fell to a monthly low of 0.79 on December 9 after an increase in short selling activity. However, this ratio has since increased to 0.90.
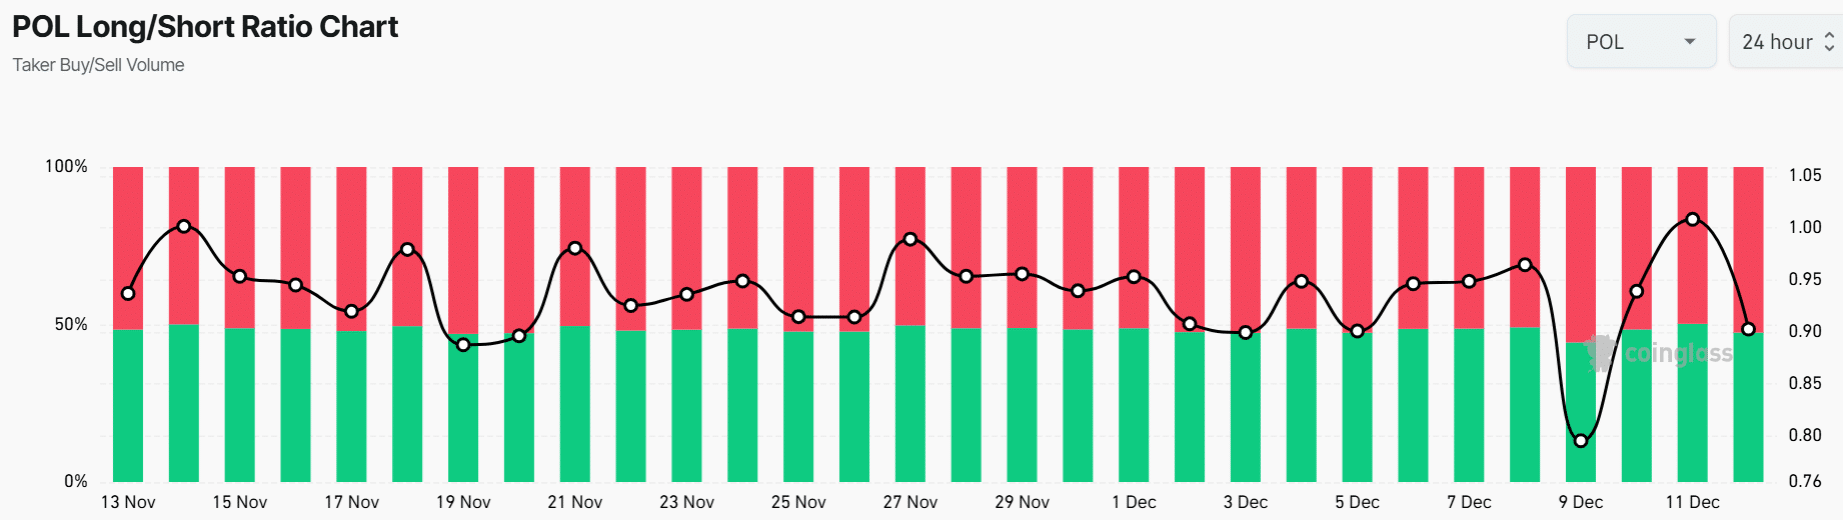
Source: Coinglass

POL’s long/short ratio still shows bearish sentiment, given that 52% of traders are short sellers. This indicates that there are fewer traders optimistic that the uptrend will continue.

Next: ALGO: As the bullish crossover emerges, where will the altcoin head next?


Source link

Share. Facebook Twitter Pinterest LinkedIn Tumblr Email
Previous ArticleCHILLGUY creator Philip Banks’ account may be compromised, granting intellectual property rights to token team
Next Article 1 million dollars for Bitcoin? Eric Trump Thinks So – Here’s What It Will Take

Related Posts

Altcoins

$1.8 Billion in 60 Minutes: How War Headlines Sparked a Historic Leverage Purge

March 1, 2026
Altcoins

Why capital isn’t flowing into crypto even as Global M2 explodes

March 1, 2026
Altcoins

Polygon Drops 11% – Can POL’s $0.90 Demand Zone Stop More Losses?

March 1, 2026
Add A Comment
Leave A Reply Cancel Reply

Single Page Post
Share
  • Facebook
  • Twitter
  • Instagram
  • YouTube
Featured Content
Event

Bitcoin 2026 Conference Announces First Wave of World-Class Speakers, Redesigned Programming, and Expanded Cultural Experience

February 24, 2026

Nashville, TN, USA — February 3, 2026 — The Bitcoin 2026 Conference, the world’s premier annual…

Event

HIPTHER Prague Summit Unveils the HIPTHER Academy

February 23, 2026

Monday, 16 February, Prague, Czech Republic – HIPTHER Prague Summit introduces the Hands-On HIPTHER Academy…

1 2 3 … 74 Next
  • Facebook
  • Twitter
  • Instagram
  • YouTube

$1.8 Billion in 60 Minutes: How War Headlines Sparked a Historic Leverage Purge

March 1, 2026

Why capital isn’t flowing into crypto even as Global M2 explodes

March 1, 2026

Polygon Drops 11% – Can POL’s $0.90 Demand Zone Stop More Losses?

March 1, 2026
Facebook X (Twitter) Instagram LinkedIn
  • About us
  • Disclaimer
  • Terms of service
  • Privacy policy
  • Contact us
© 2026 Altcoin Observer. all rights reserved by Tech Team.

Type above and press Enter to search. Press Esc to cancel.

bitcoin
Bitcoin (BTC) $ 66,088.00
ethereum
Ethereum (ETH) $ 1,970.57
tether
Tether (USDT) $ 0.999998
bnb
BNB (BNB) $ 622.32
xrp
XRP (XRP) $ 1.37
usd-coin
USDC (USDC) $ 0.999998
solana
Solana (SOL) $ 84.08
tron
TRON (TRX) $ 0.281529
figure-heloc
Figure Heloc (FIGR_HELOC) $ 1.03
staked-ether
Lido Staked Ether (STETH) $ 2,265.05