Close Menu
Altcoin ObserverAltcoin Observer
  • Regulation
  • Bitcoin
  • Altcoins
  • Market
  • Analysis
  • DeFi
  • Security
  • Ethereum
Categories
  • Altcoins (3,056)
  • Analysis (3,185)
  • Bitcoin (3,798)
  • Blockchain (2,157)
  • DeFi (2,623)
  • Ethereum (2,557)
  • Event (118)
  • Exclusive Deep Dive (1)
  • Landscape Ads (2)
  • Market (2,714)
  • Press Releases (12)
  • Reddit (2,486)
  • Regulation (2,461)
  • Security (3,620)
  • Thought Leadership (3)
  • Videos (44)
Hand picked
  • Stablecoin payments go ‘invisible’ in Southeast Asia as crypto card business surges
  • Introducing Krak Concierge: Turn Your Hotel & Travel Spending Into Meaningful Rewards
  • Solana Bets Rise as Franklin’s SOEZ ETF Attracts $1.53M Overnight
  • Ethereum price recovery accelerates, is a breakout brewing?
  • AccuQuant Launches Next-Generation Intelligent Quantitative Trading System to Empower Users Worldwide to Optimize Their Trading Decisions.
We are social
  • Facebook
  • Twitter
  • Instagram
  • YouTube
Facebook X (Twitter) Instagram
  • About us
  • Disclaimer
  • Terms of service
  • Privacy policy
  • Contact us
Facebook X (Twitter) Instagram YouTube LinkedIn
Altcoin ObserverAltcoin Observer
  • Regulation
  • Bitcoin
  • Altcoins
  • Market
  • Analysis
  • DeFi
  • Security
  • Ethereum
Events
Altcoin ObserverAltcoin Observer
Home»Altcoins»Hyperliquid: HYPE could see a rebound based on THESE key levels
Altcoins

Hyperliquid: HYPE could see a rebound based on THESE key levels

January 8, 2025No Comments
Share Facebook Twitter Pinterest LinkedIn Tumblr Reddit Telegram Email
Editors 74 1000x600.jpg
Share
Facebook Twitter LinkedIn Pinterest Email


  • HYPE is currently trading in a descending channel, with further downside potential depending on how it reacts to its current level.
  • Key indicators and Total Value Locked (TVL) remain bearish. However, the RSI is gradually suggesting that the selling pressure may be easing.

Hyperliquid (HYPE) ranks among the top losers in the market, down 16.57% in the last 24 hours. This drop reduced his monthly gains to 64.93%.

How the token performs at its current price level will determine whether it experiences a significant rally or faces further losses as market sentiment weakens.

Will HYPE relate positively to this model?

Technical analysis of the 4-hour chart of HYPE reveals that the asset is trading in a descending channel, characterized by lower highs and lower lows. Investors continue to accumulate in anticipation of an upward move.

A bullish breakout of this pattern occurs when price crosses the upper resistance line of the channel, potentially reaching its high of $35.7.

At the time of writing, HYPE is trading within a support zone at $21.59, which has already acted as a bullish catalyst three times. If this support provides the required momentum, HYPE could rebound and gain 65.44%, reaching the mentioned high.
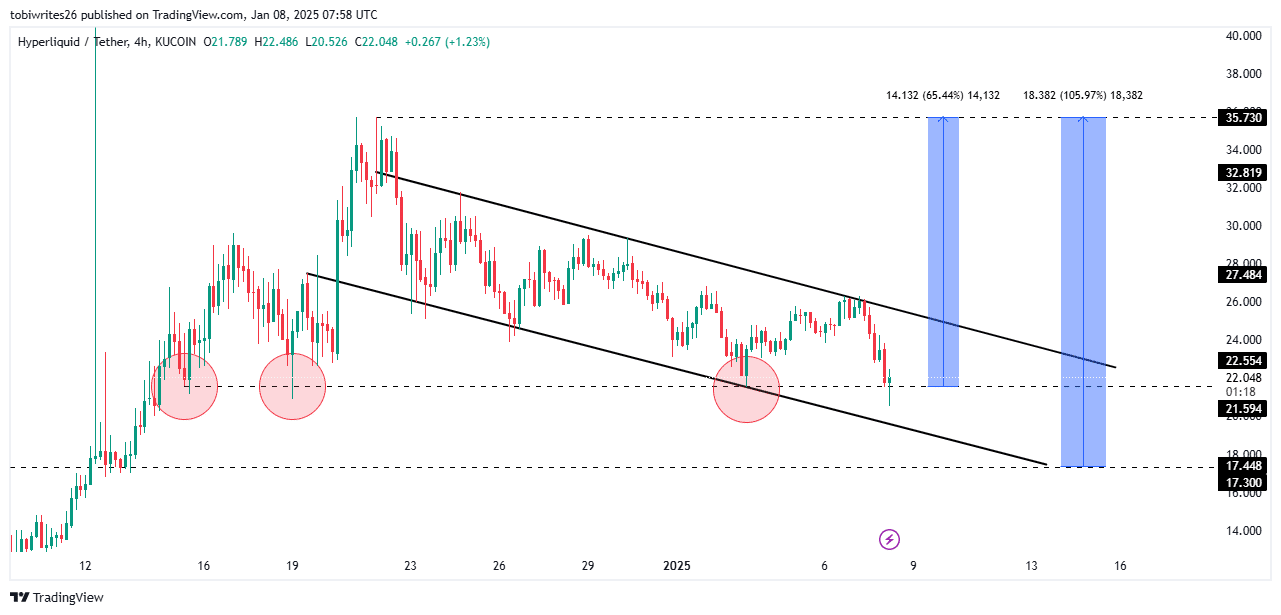
Source: TradingView

However, if the support level at $21.59 is breached, HYPE could fall to the next support at $17.30. This level could act as a catalyst for a final push higher, potentially resulting in a 105.97% gain.

Mixed market signals

Currently, an analysis of technical indicators reveals mixed market sentiment, reflected by trader activity close to the support level.

The Parabolic SAR (Stop and Reverse), which identifies trend directions and reversals through points placed above or below price movements, is currently showing points above HYPE.

Points above the price suggest bearish market sentiment for HYPE, indicating that it could fall further from its current zone.
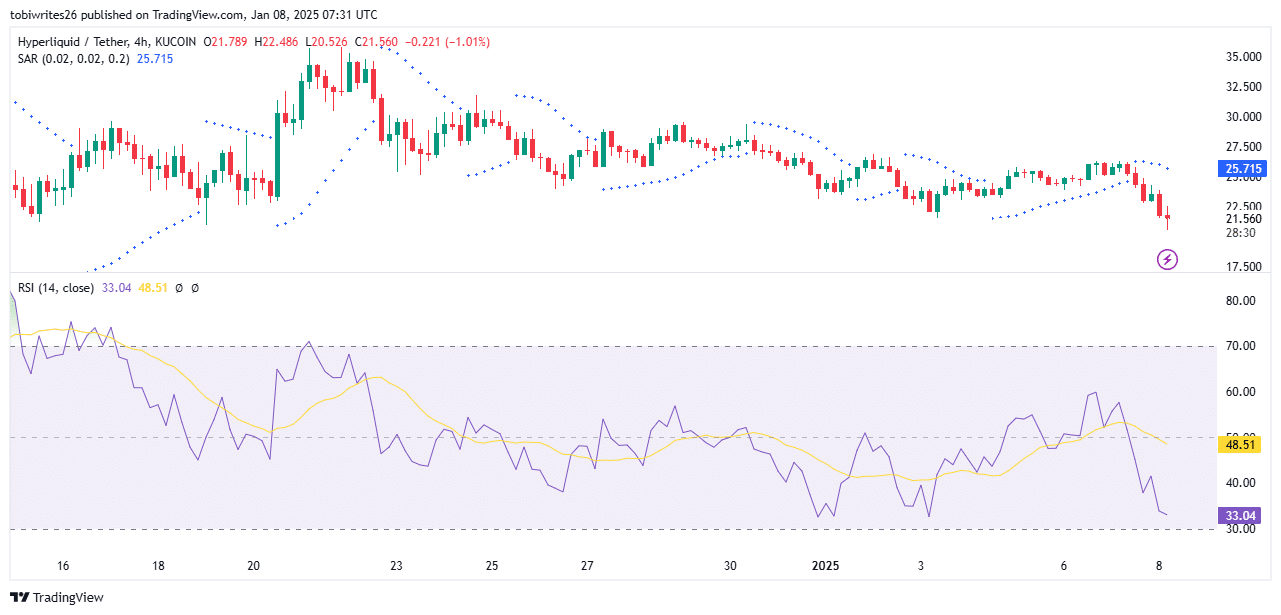
Source: TradingView

Meanwhile, the Relative Strength Index (RSI), another technical indicator, measures the speed and magnitude of price changes to identify overbought or oversold conditions.

At the time of writing, the RSI stood at 33.04, indicating increasing selling pressure as it approaches the oversold region. The RSI was heading towards the oversold region (below 30), suggesting that selling pressure may ease at this level.

If HYPE falls below the 30 mark, it could rebound and begin a recovery. However, HYPE could reverse its trend from the current level without going below 30.

Cash outflow hits HYPE

HYPE saw significant cash outflows as its TVL fell to $1.553 billion, a level last seen on December 14. This follows a peak of $2.244 billion on January 2.
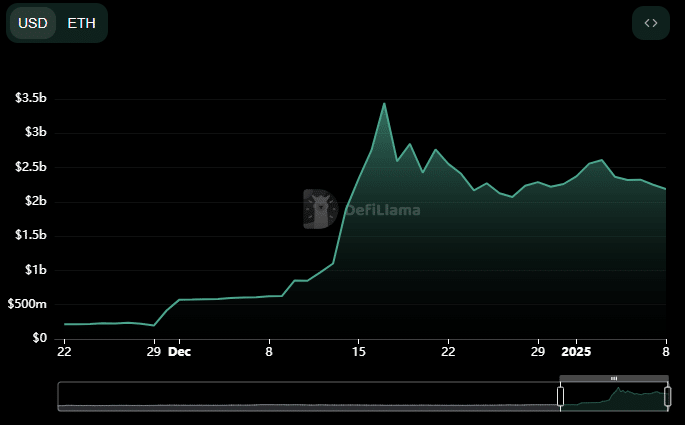
Source: DeFiLlama


Read Hyperliquid (HYPE) Price Forecast 2025-2026


Cash outflows in TVL indicate declining interest, which often negatively impacts the price of HYPE and could lead to further declines.

If liquidity outflows persist, HYPE could continue to decline from its current level, or even fall to even lower levels.

Next: dogwifhat whale collects $13.34 million WIF: impact on price?


Source link

Share. Facebook Twitter Pinterest LinkedIn Tumblr Email
Previous ArticleBrett (BASED) Price Prediction – Can It Still Make Investors Millionaires?
Next Article Why is Bitcoin falling: Bulls and bears clash over BTC price

Related Posts

Altcoins

Solana Bets Rise as Franklin’s SOEZ ETF Attracts $1.53M Overnight

April 1, 2026
Altcoins

Analyze whether FET can maintain its decisive level or fall to $0.20

April 1, 2026
Altcoins

Crypto XRP Holders Pull Coins From Exchanges and On-Chain Data Signals Provide Shock

March 31, 2026
Add A Comment
Leave A Reply Cancel Reply

Single Page Post
Share
  • Facebook
  • Twitter
  • Instagram
  • YouTube
Featured Content
Event

Global Games Show Riyadh: The Ultimate Creator & Influencer Hub

March 31, 2026

The fast-evolving gaming ecosystem of Riyadh is powered by solid national investment, a flourishing esports…

Event

AI Future: The leading international forum on Artificial Intelligence & Web3

March 30, 2026

On April 14–15, AI Future will gather developers, researchers, entrepreneurs, investors, and representatives of major…

1 2 3 … 81 Next
  • Facebook
  • Twitter
  • Instagram
  • YouTube

Solana Bets Rise as Franklin’s SOEZ ETF Attracts $1.53M Overnight

April 1, 2026

Analyze whether FET can maintain its decisive level or fall to $0.20

April 1, 2026

Crypto XRP Holders Pull Coins From Exchanges and On-Chain Data Signals Provide Shock

March 31, 2026
Facebook X (Twitter) Instagram LinkedIn
  • About us
  • Disclaimer
  • Terms of service
  • Privacy policy
  • Contact us
© 2026 Altcoin Observer. all rights reserved by Tech Team.

Type above and press Enter to search. Press Esc to cancel.

bitcoin
Bitcoin (BTC) $ 68,601.00
ethereum
Ethereum (ETH) $ 2,136.60
tether
Tether (USDT) $ 0.999181
bnb
BNB (BNB) $ 617.74
xrp
XRP (XRP) $ 1.35
usd-coin
USDC (USDC) $ 0.99971
solana
Solana (SOL) $ 84.22
tron
TRON (TRX) $ 0.316137
figure-heloc
Figure Heloc (FIGR_HELOC) $ 1.03
staked-ether
Lido Staked Ether (STETH) $ 2,265.05