




Close Menu
Altcoin ObserverAltcoin Observer
  • Regulation
  • Bitcoin
  • Altcoins
  • Market
  • Analysis
  • DeFi
  • Security
  • Ethereum
Categories
  • Altcoins (3,706)
  • Analysis (3,814)
  • Bitcoin (4,443)
  • Blockchain (2,157)
  • DeFi (2,623)
  • Ethereum (2,769)
  • Event (119)
  • Exclusive Deep Dive (1)
  • Landscape Ads (2)
  • Market (2,714)
  • Press Releases (12)
  • Reddit (2,847)
  • Regulation (2,474)
  • Security (4,078)
  • Thought Leadership (3)
  • Videos (44)
Hand picked
  • A busy week ahead: Fed decision, Big Tech results and expiration of cryptocurrencies at the end of the month
  • Audiera gains 13% with the return of the whales – can BEAT extend its rally?
  • Pavel Durov’s native Telegram wallet game: what it means for Gram’s price
  • Grid Trading on Zoomex: How to Profit from Sideways Markets
  • Satsuma’s Bitcoin cash flow collapses, leaving shareholders 18p on the pound
We are social
  • Facebook
  • Twitter
  • Instagram
  • YouTube
Facebook X (Twitter) Instagram
  • About us
  • Disclaimer
  • Terms of service
  • Privacy policy
  • Contact us
Facebook X (Twitter) Instagram YouTube LinkedIn
Altcoin ObserverAltcoin Observer
  • Regulation
  • Bitcoin
  • Altcoins
  • Market
  • Analysis
  • DeFi
  • Security
  • Ethereum
Events
Altcoin ObserverAltcoin Observer
Home»Bitcoin»CryptoQuant’s Bitcoin Cycle Indicator Shows Bear Market Is Now Underway
Bitcoin

CryptoQuant’s Bitcoin Cycle Indicator Shows Bear Market Is Now Underway

August 8, 2024No Comments
Share Facebook Twitter Pinterest LinkedIn Tumblr Reddit Telegram Email
Btc 527bcd.webp.jpeg
Share
Facebook Twitter LinkedIn Pinterest Email


A Bitcoin cycle indicator from analytics firm CryptoQuant suggests that BTC has transitioned into a bearish phase following the crash.

CryptoQuant’s Bitcoin Bull-Bear Cycle Indicator Now in Negative Territory

In a new article on X, CryptoQuant’s Head of Research Julio Moreno discussed the latest development of the “Bull-Bear Market Cycle Indicator” designed by the analytics firm.

This metric is based on CryptoQuant’s P&L index, which itself is a unification of a few different popular on-chain metrics related to unrealized and realized profit/loss.

The P&L index is basically used to determine whether BTC is currently in a bear or bull market. When the indicator crosses above its 365-day moving average (MA), it can be assumed that BTC has entered a bullish phase. Similarly, a drop below the MA implies a bearish transition.

The Bull-Bear Market Cycle Indicator, the actual metric we’re focusing on here, visualizes the P&L index in a more convenient form by keeping track of its distance from its 365-day moving average.

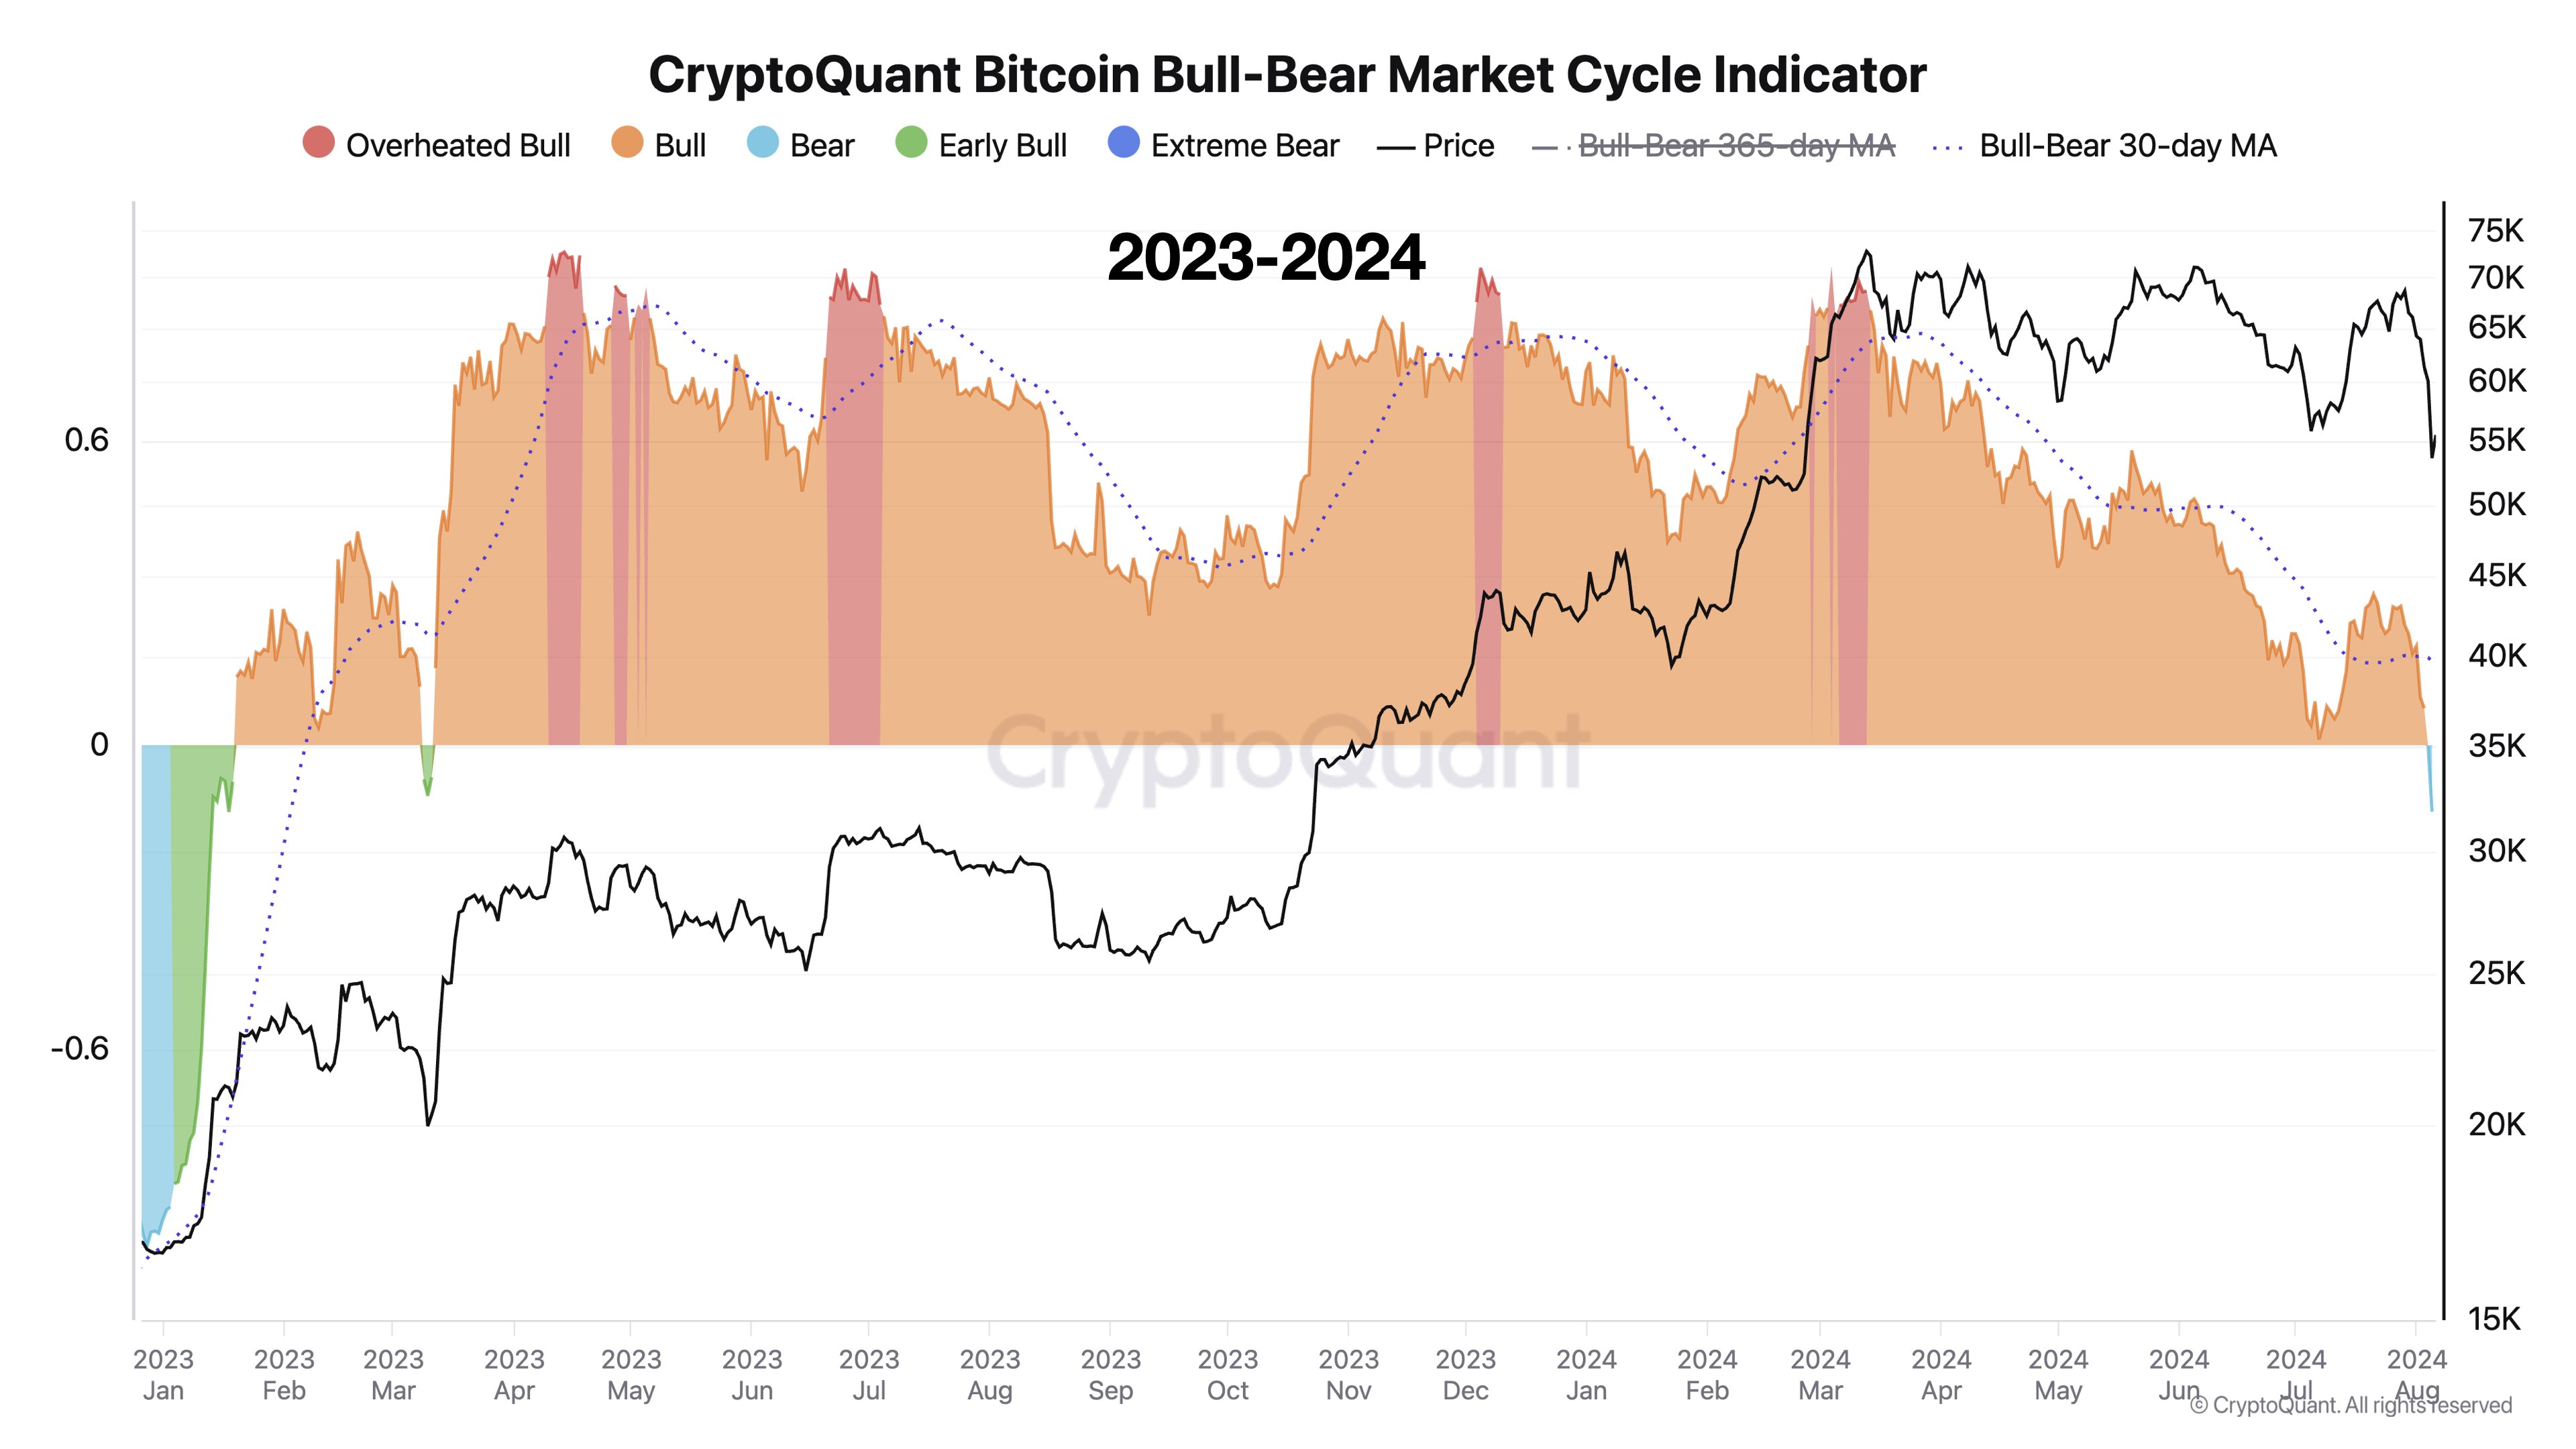
Now here is a chart that shows the trend of this Bitcoin indicator over the past two years:
Bitcoin Market Bullish-Bearish Cycle Indicator

The value of the metric appears to have plunged into the negative territory in recent days | Source: @jjcmoreno on X

As seen in the chart above, Bitcoin’s bull-bear market cycle indicator had spiked earlier in the year as the asset’s price hit a new all-time high (ATH) and reached territory known as the “overheated bull.”

At these values, the P&L index is significantly away from its 365-day moving average, which is why the asset price is considered overheated. Along with these overheated values, the asset has reached a peak that continues to be the peak of the rally so far.

After spending months in normal bullish territory, the indicator appears to have dipped below the zero mark, implying that the P&L index has now crossed below its 365-day moving average.

The bull-bear market cycle indicator is now signaling a bearish phase for Bitcoin. Moreno notes that this is the first time since January 2023 that the indicator has given this signal.

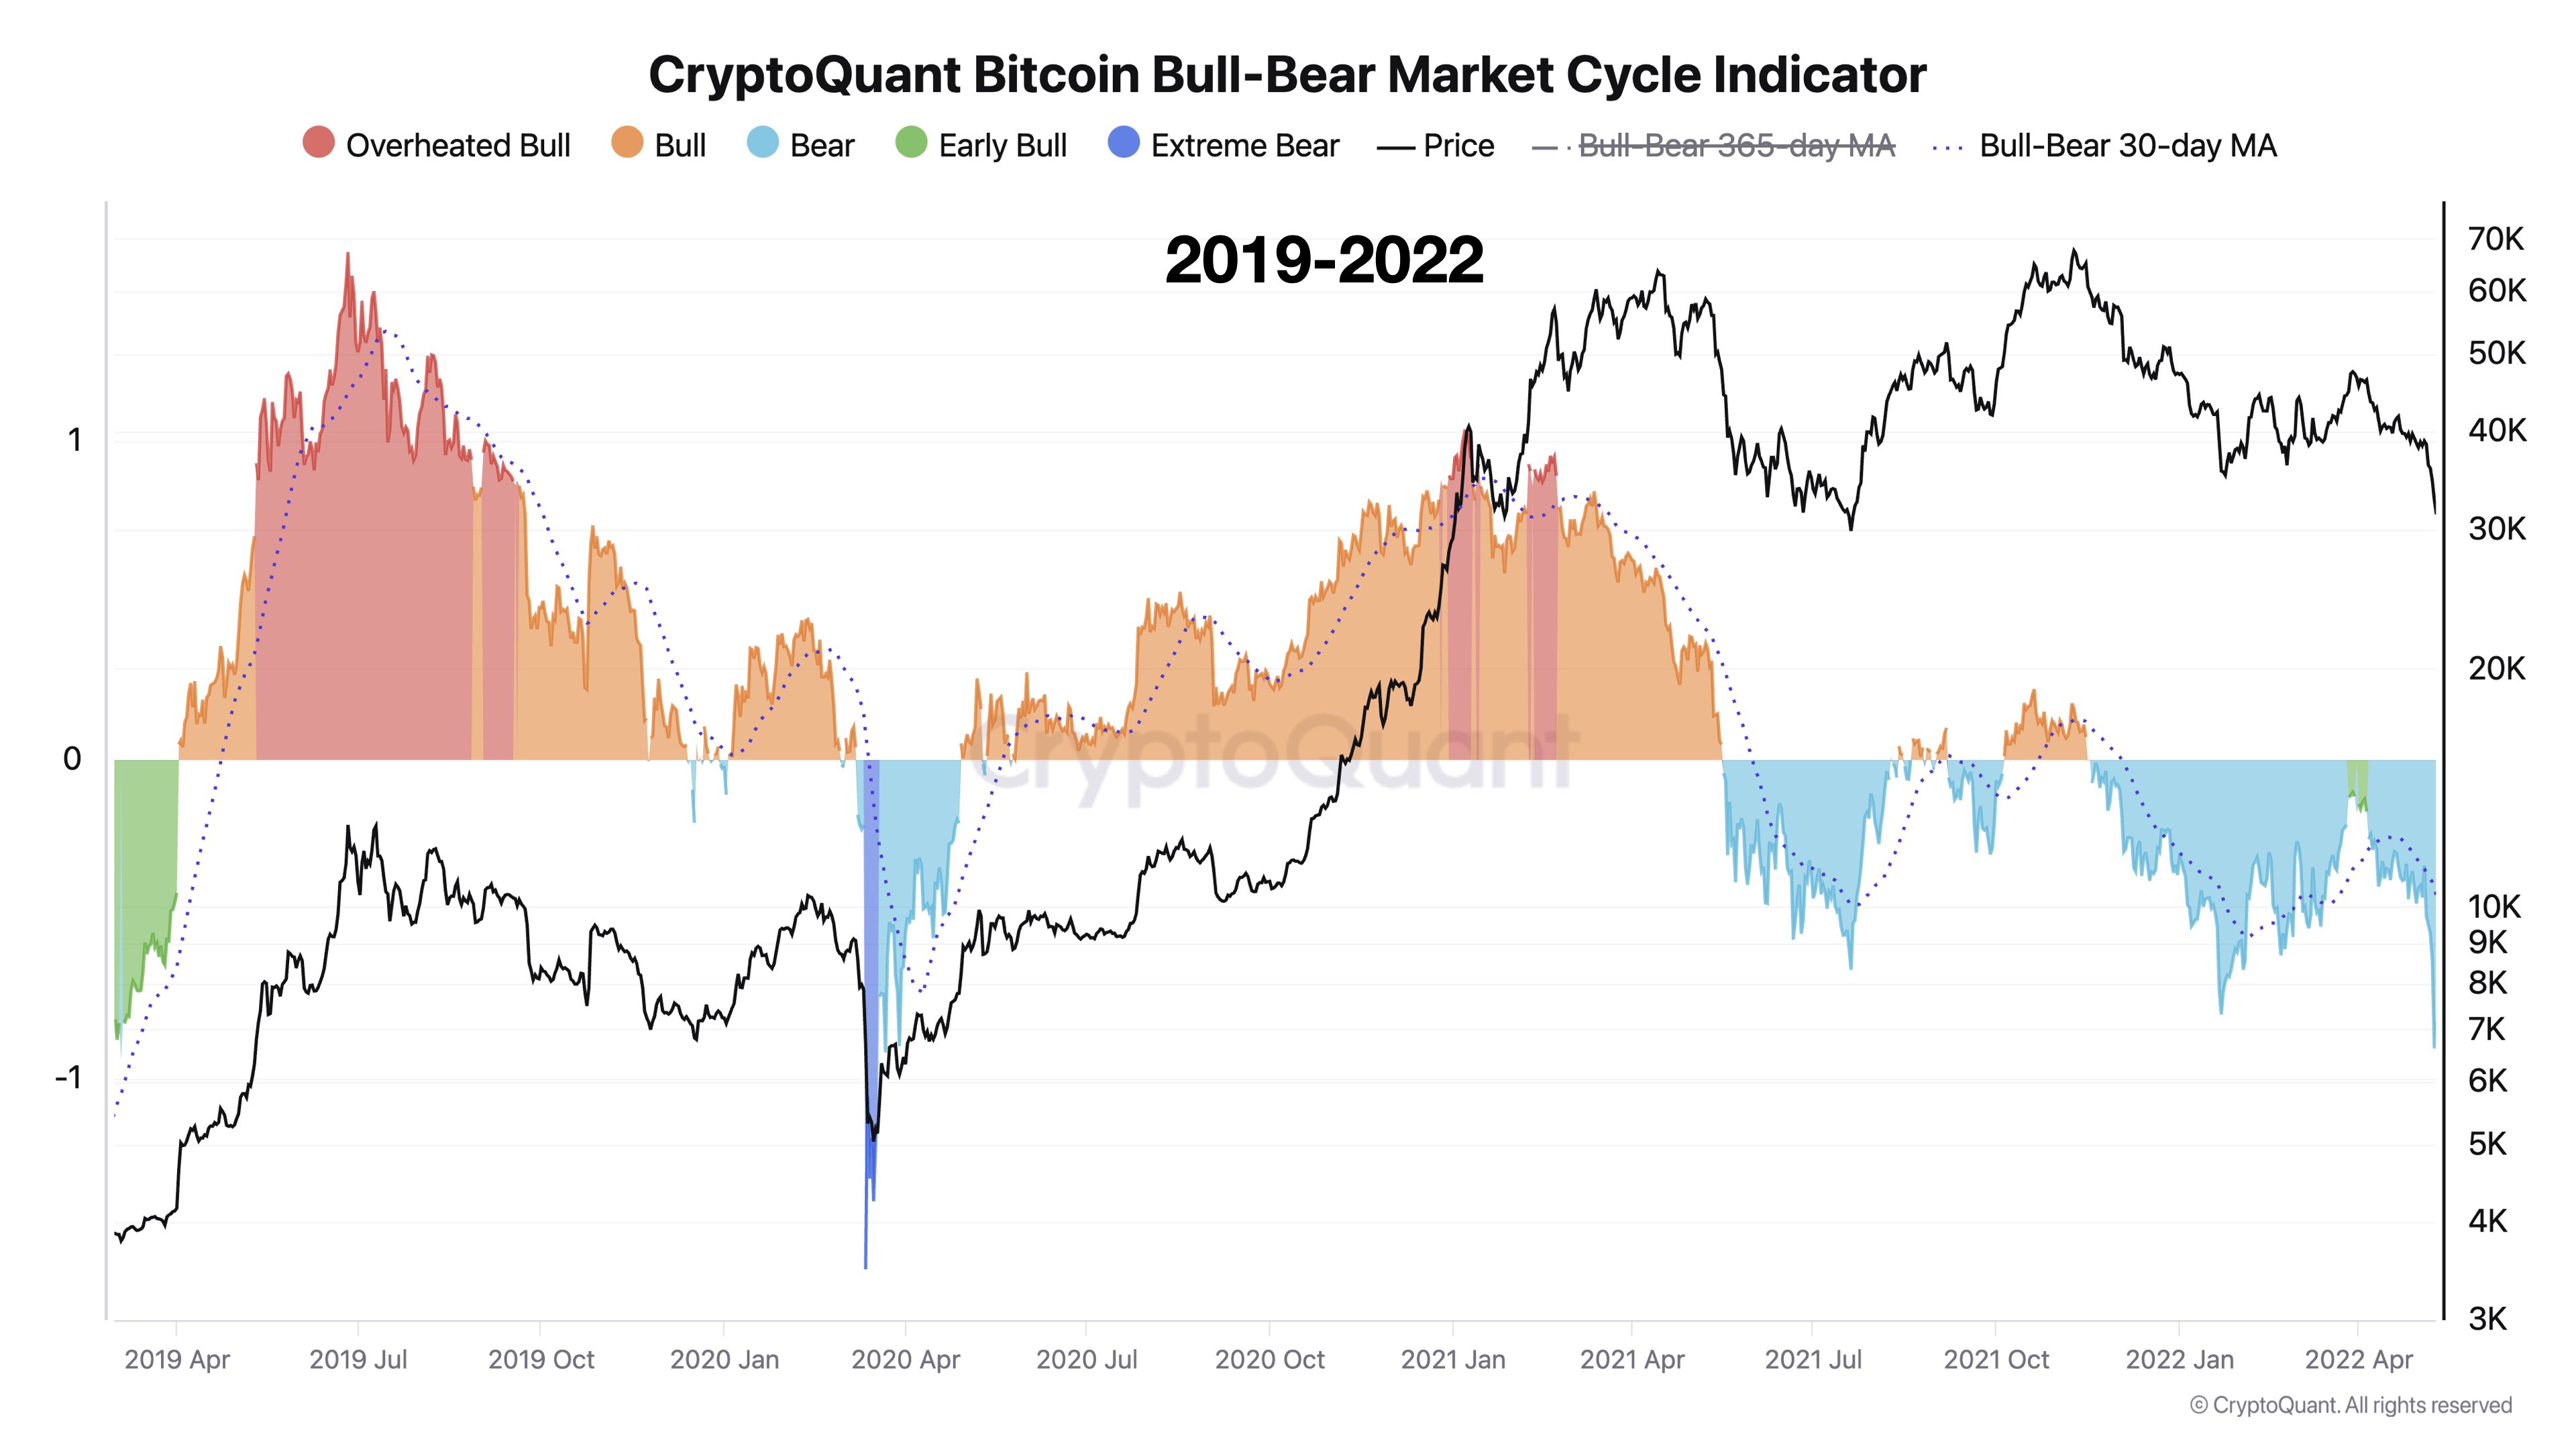
It should be kept in mind, however, that this signal does not necessarily mean that the cryptocurrency is heading towards a prolonged bear market. As the head of CryptoQuant pointed out, there have been periods in the past when the indicator only temporarily signaled a bearish phase for BTC.
Bitcoin Bearish Phases

The previous bear phases for the asset | Source: @jjcmoreno on X

From the chart, it is clear that the COVID-19 crash in March 2020 and the mining ban in China in May 2021 both led to temporary bearish phases from the indicator’s perspective.

It now remains to be seen whether the Bitcoin bull-bear market cycle indicator will also remain in the negative territory for a brief period this time or not.

BTC Price

At the time of writing, Bitcoin is trading just below the $57,000 level, down nearly 14% over the past seven days.

Bitcoin Price Chart

Looks like the price of the coin has been making recovery since the crash | Source: BTCUSD on TradingView

Featured image by Dall-E, CryptoQuant.com, chart by TradingView.com


Source link

Share. Facebook Twitter Pinterest LinkedIn Tumblr Email
Previous ArticleIndustrie-Lösungen im Fokus – Der Altcoinspekulant
Next Article Ethereum network activity plummets, transaction volume falls to five-month low

Related Posts

Bitcoin

A busy week ahead: Fed decision, Big Tech results and expiration of cryptocurrencies at the end of the month

July 22, 2026
Bitcoin

Satsuma’s Bitcoin cash flow collapses, leaving shareholders 18p on the pound

July 22, 2026
Bitcoin

Jupiter Surpasses $1 Trillion in Cumulative Solana Swap Volume

July 22, 2026
Add A Comment
Leave A Reply Cancel Reply

Single Page Post
Share
  • Facebook
  • Twitter
  • Instagram
  • YouTube
Featured Content
Event

Dutch Blockchain Week 2026 strengthens position as Europe’s leading B2B blockchain event week

April 14, 2026

Amsterdam, April 2026 – Dutch Blockchain Week 2026 is rapidly evolving into one of Europe’s…

Event

Global Games Show Riyadh: The Ultimate Creator & Influencer Hub

March 31, 2026

The fast-evolving gaming ecosystem of Riyadh is powered by solid national investment, a flourishing esports…

1 2 3 … 82 Next
  • Facebook
  • Twitter
  • Instagram
  • YouTube

Audiera gains 13% with the return of the whales – can BEAT extend its rally?

July 22, 2026

Is ADA Underestimating the Risk of SecondFi’s $2.4 Million Exploit?

July 22, 2026

LAB Unlocks 1.87 Million Tokens Per Day Until 2028 – Can Demand Keep Up?

July 22, 2026
Facebook X (Twitter) Instagram LinkedIn
  • About us
  • Disclaimer
  • Terms of service
  • Privacy policy
  • Contact us
© 2026 Altcoin Observer. all rights reserved by Tech Team.

Type above and press Enter to search. Press Esc to cancel.

bitcoin
Bitcoin (BTC) $ 66,058.00
ethereum
Ethereum (ETH) $ 1,933.07
tether
Tether (USDT) $ 0.99942
bnb
BNB (BNB) $ 570.72
usd-coin
USDC (USDC) $ 0.999932
xrp
XRP (XRP) $ 1.14
solana
Solana (SOL) $ 77.96
tron
TRON (TRX) $ 0.328752
figure-heloc
Figure Heloc (FIGR_HELOC) $ 1.01
staked-ether
Lido Staked Ether (STETH) $ 2,265.05