




Close Menu
Altcoin ObserverAltcoin Observer
  • Regulation
  • Bitcoin
  • Altcoins
  • Market
  • Analysis
  • DeFi
  • Security
  • Ethereum
Categories
  • Altcoins (3,732)
  • Analysis (3,840)
  • Bitcoin (4,470)
  • Blockchain (2,157)
  • DeFi (2,623)
  • Ethereum (2,773)
  • Event (119)
  • Exclusive Deep Dive (1)
  • Landscape Ads (2)
  • Market (2,714)
  • Press Releases (12)
  • Reddit (2,847)
  • Regulation (2,474)
  • Security (4,103)
  • Thought Leadership (3)
  • Videos (44)
Hand picked
  • Uniswap RFC explores running private exchanges using v4 and UniswapX hooks
  • Australia targets Telegram a day after Russia indicts Durov
  • Bitcoin’s weak hands fold
  • Success Story: Jonathan Nichols’ Learning Journey with 101 Blockchains
  • Kraken Cyprus honored at the 14th Invest Cyprus International Investment Awards
We are social
  • Facebook
  • Twitter
  • Instagram
  • YouTube
Facebook X (Twitter) Instagram
  • About us
  • Disclaimer
  • Terms of service
  • Privacy policy
  • Contact us
Facebook X (Twitter) Instagram YouTube LinkedIn
Altcoin ObserverAltcoin Observer
  • Regulation
  • Bitcoin
  • Altcoins
  • Market
  • Analysis
  • DeFi
  • Security
  • Ethereum
Events
Altcoin ObserverAltcoin Observer
Home»Bitcoin»Polkadot targets $10: Falling wedge pattern on DOT chart means…
Bitcoin

Polkadot targets $10: Falling wedge pattern on DOT chart means…

August 12, 2024No Comments
Share Facebook Twitter Pinterest LinkedIn Tumblr Reddit Telegram Email
Polkadots Latest Bullish Pattern 1000x600.webp.webp
Share
Facebook Twitter LinkedIn Pinterest Email


  • Polkadot price has increased by double digits in the past week, but the last 24 hours have been bearish.
  • Most indicators point to an increase in prices, which could lead to a breakout of an uptrend.

After a week of promising price increases, Dots (DOT) Bears took control of the market as its price declined in the past few hours. However, the story was more complex as a bullish pattern formed on the token’s price chart.

Let’s see if DOT can surpass the model in the near future.

The Next Polkadot Rally

Data from CoinMarketCap revealed that Polkadot’s price has increased by more than 13% over the past week. But the scenario has changed in the past 24 hours, with its value dropping by more than 5%.

At the time of writing, DOT was trading at $4.57 with a market cap of over $6.6 billion, making it the 14th largest crypto.

The negative price action impacted its social indicators as its weighted sentiment fell into the negative zone. This means that the bearish sentiment around the token has increased.

His social volume has also seen a gradual decline, reflecting a decline in his popularity.
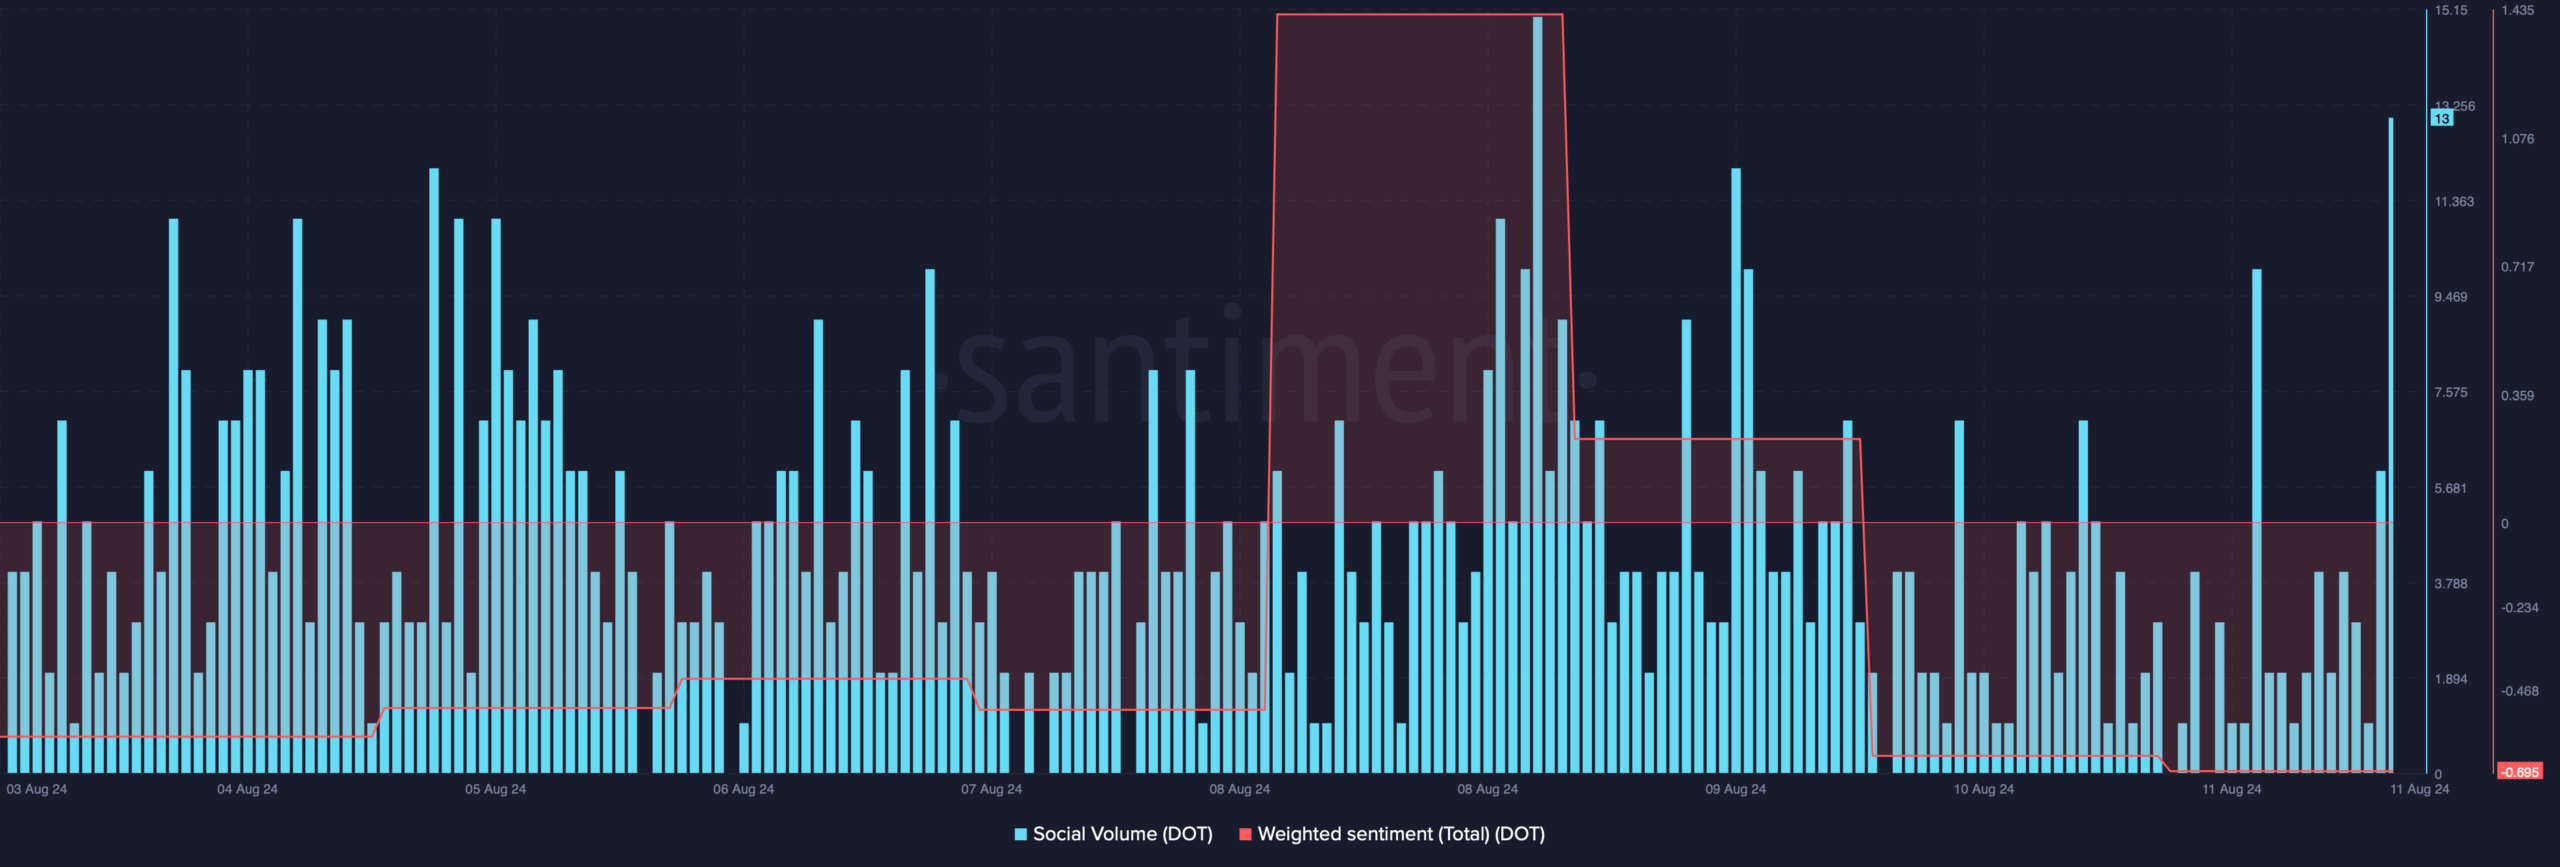
Polkadot's Weighted Sentiment DropsPolkadot's Weighted Sentiment Drops

Source: Santiment

Meanwhile, ZAYK Charts, a popular crypto analyst, recently published a tweethighlighting an interesting development. According to the tweet, a bullish falling wedge pattern has appeared on the token’s 2-day chart.

The pattern emerged in early 2024 and since then, DOT has been consolidating within the pattern. At press time, it was showing signs of a breakout.

If this happens, it could push Polkadot towards $10 in the coming weeks or months.

Source: X

Is an escape possible?

AMBCrypto then evaluated the token’s on-chain data to determine if a breakout seemed likely. Our analysis of Santiment’s data revealed that DOT’s trading volume dropped alongside its price.

This indicates that the DOT may soon record greens.

Additionally, its open interest has also stopped. Whenever the metric goes down, it portends a trend reversal.

It is worth noting that while price action has remained volatile, DOT development activity has remained high, a front on which DOT has dominated for several years.
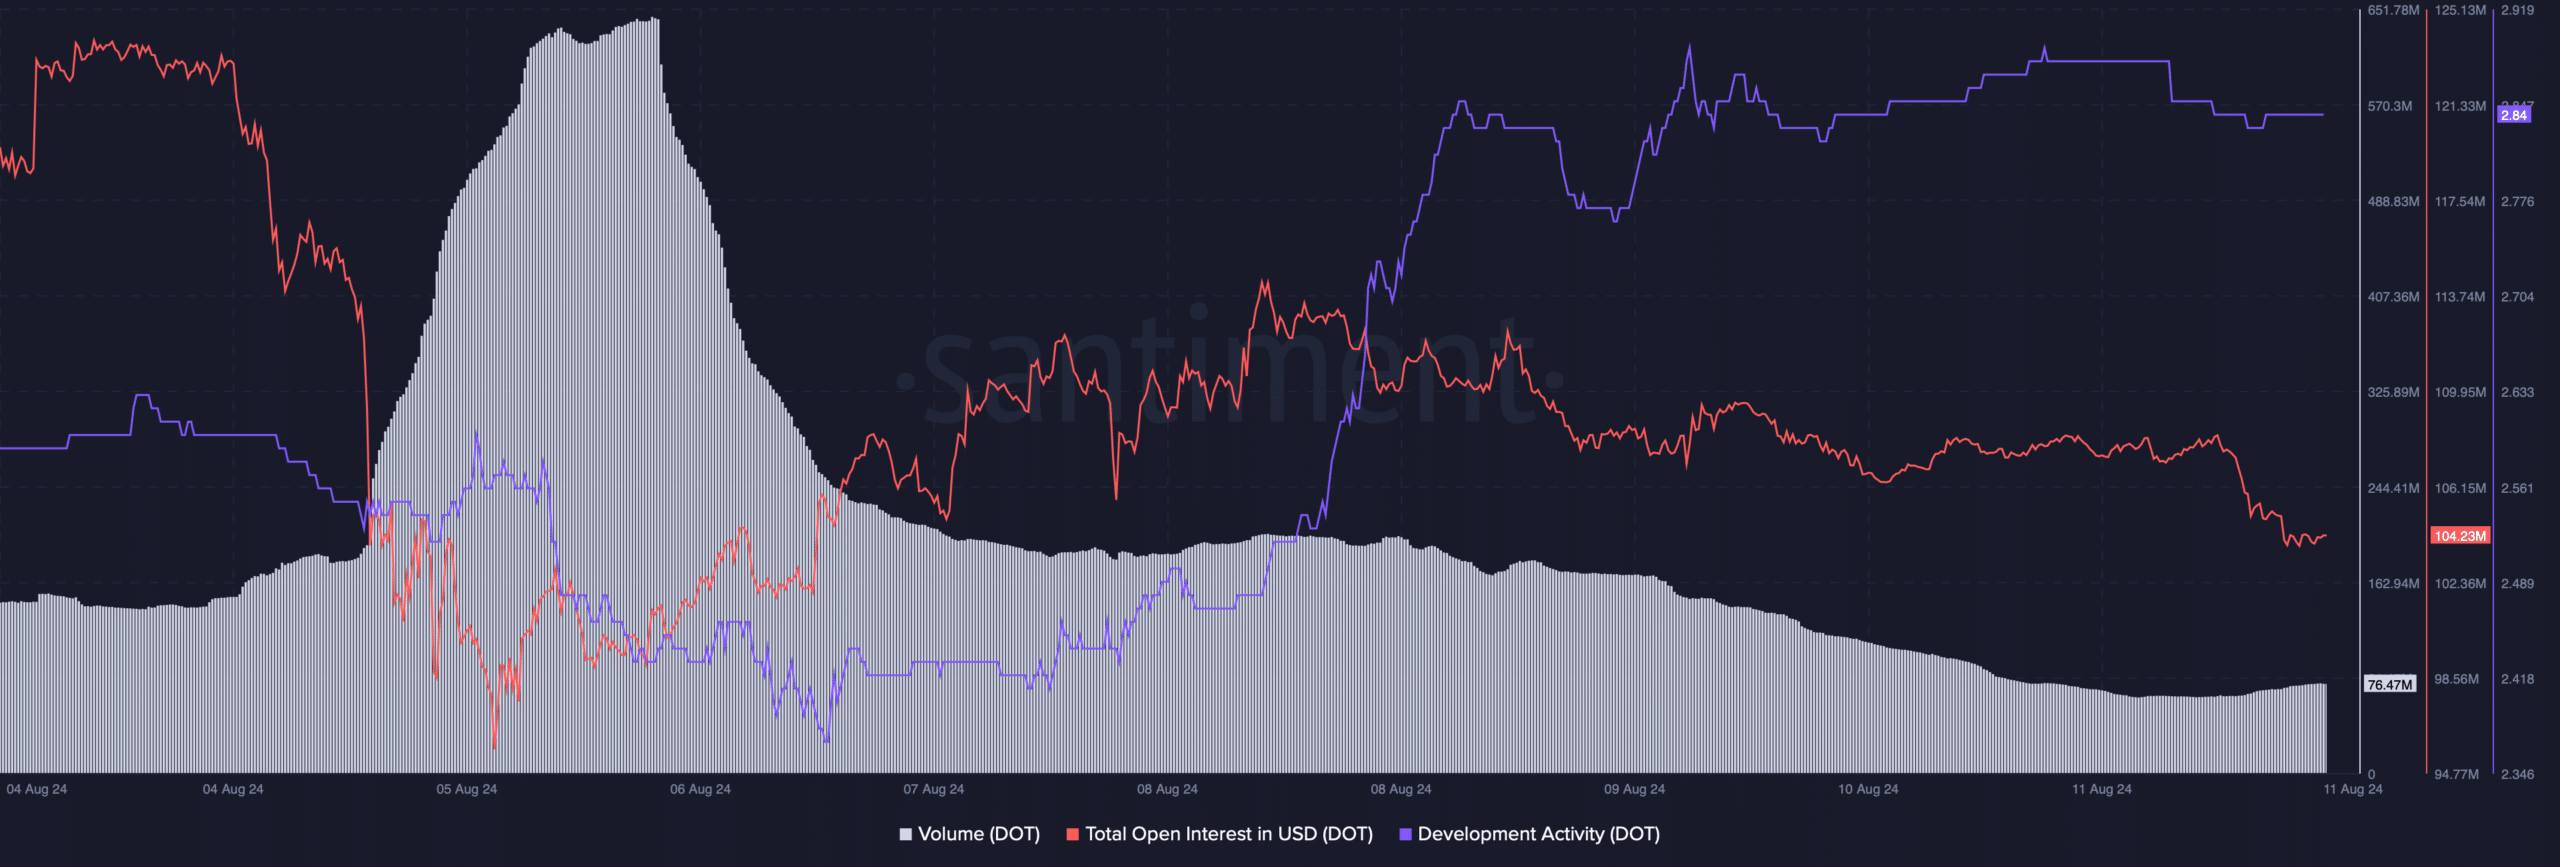
DOT volume has decreasedDOT volume has decreased

Source: Santiment

In addition to this, at the time of writing, Polkadot fear and greed index was in a “fear” phase. Whenever this happens, it suggests that the chances of a price increase are high.

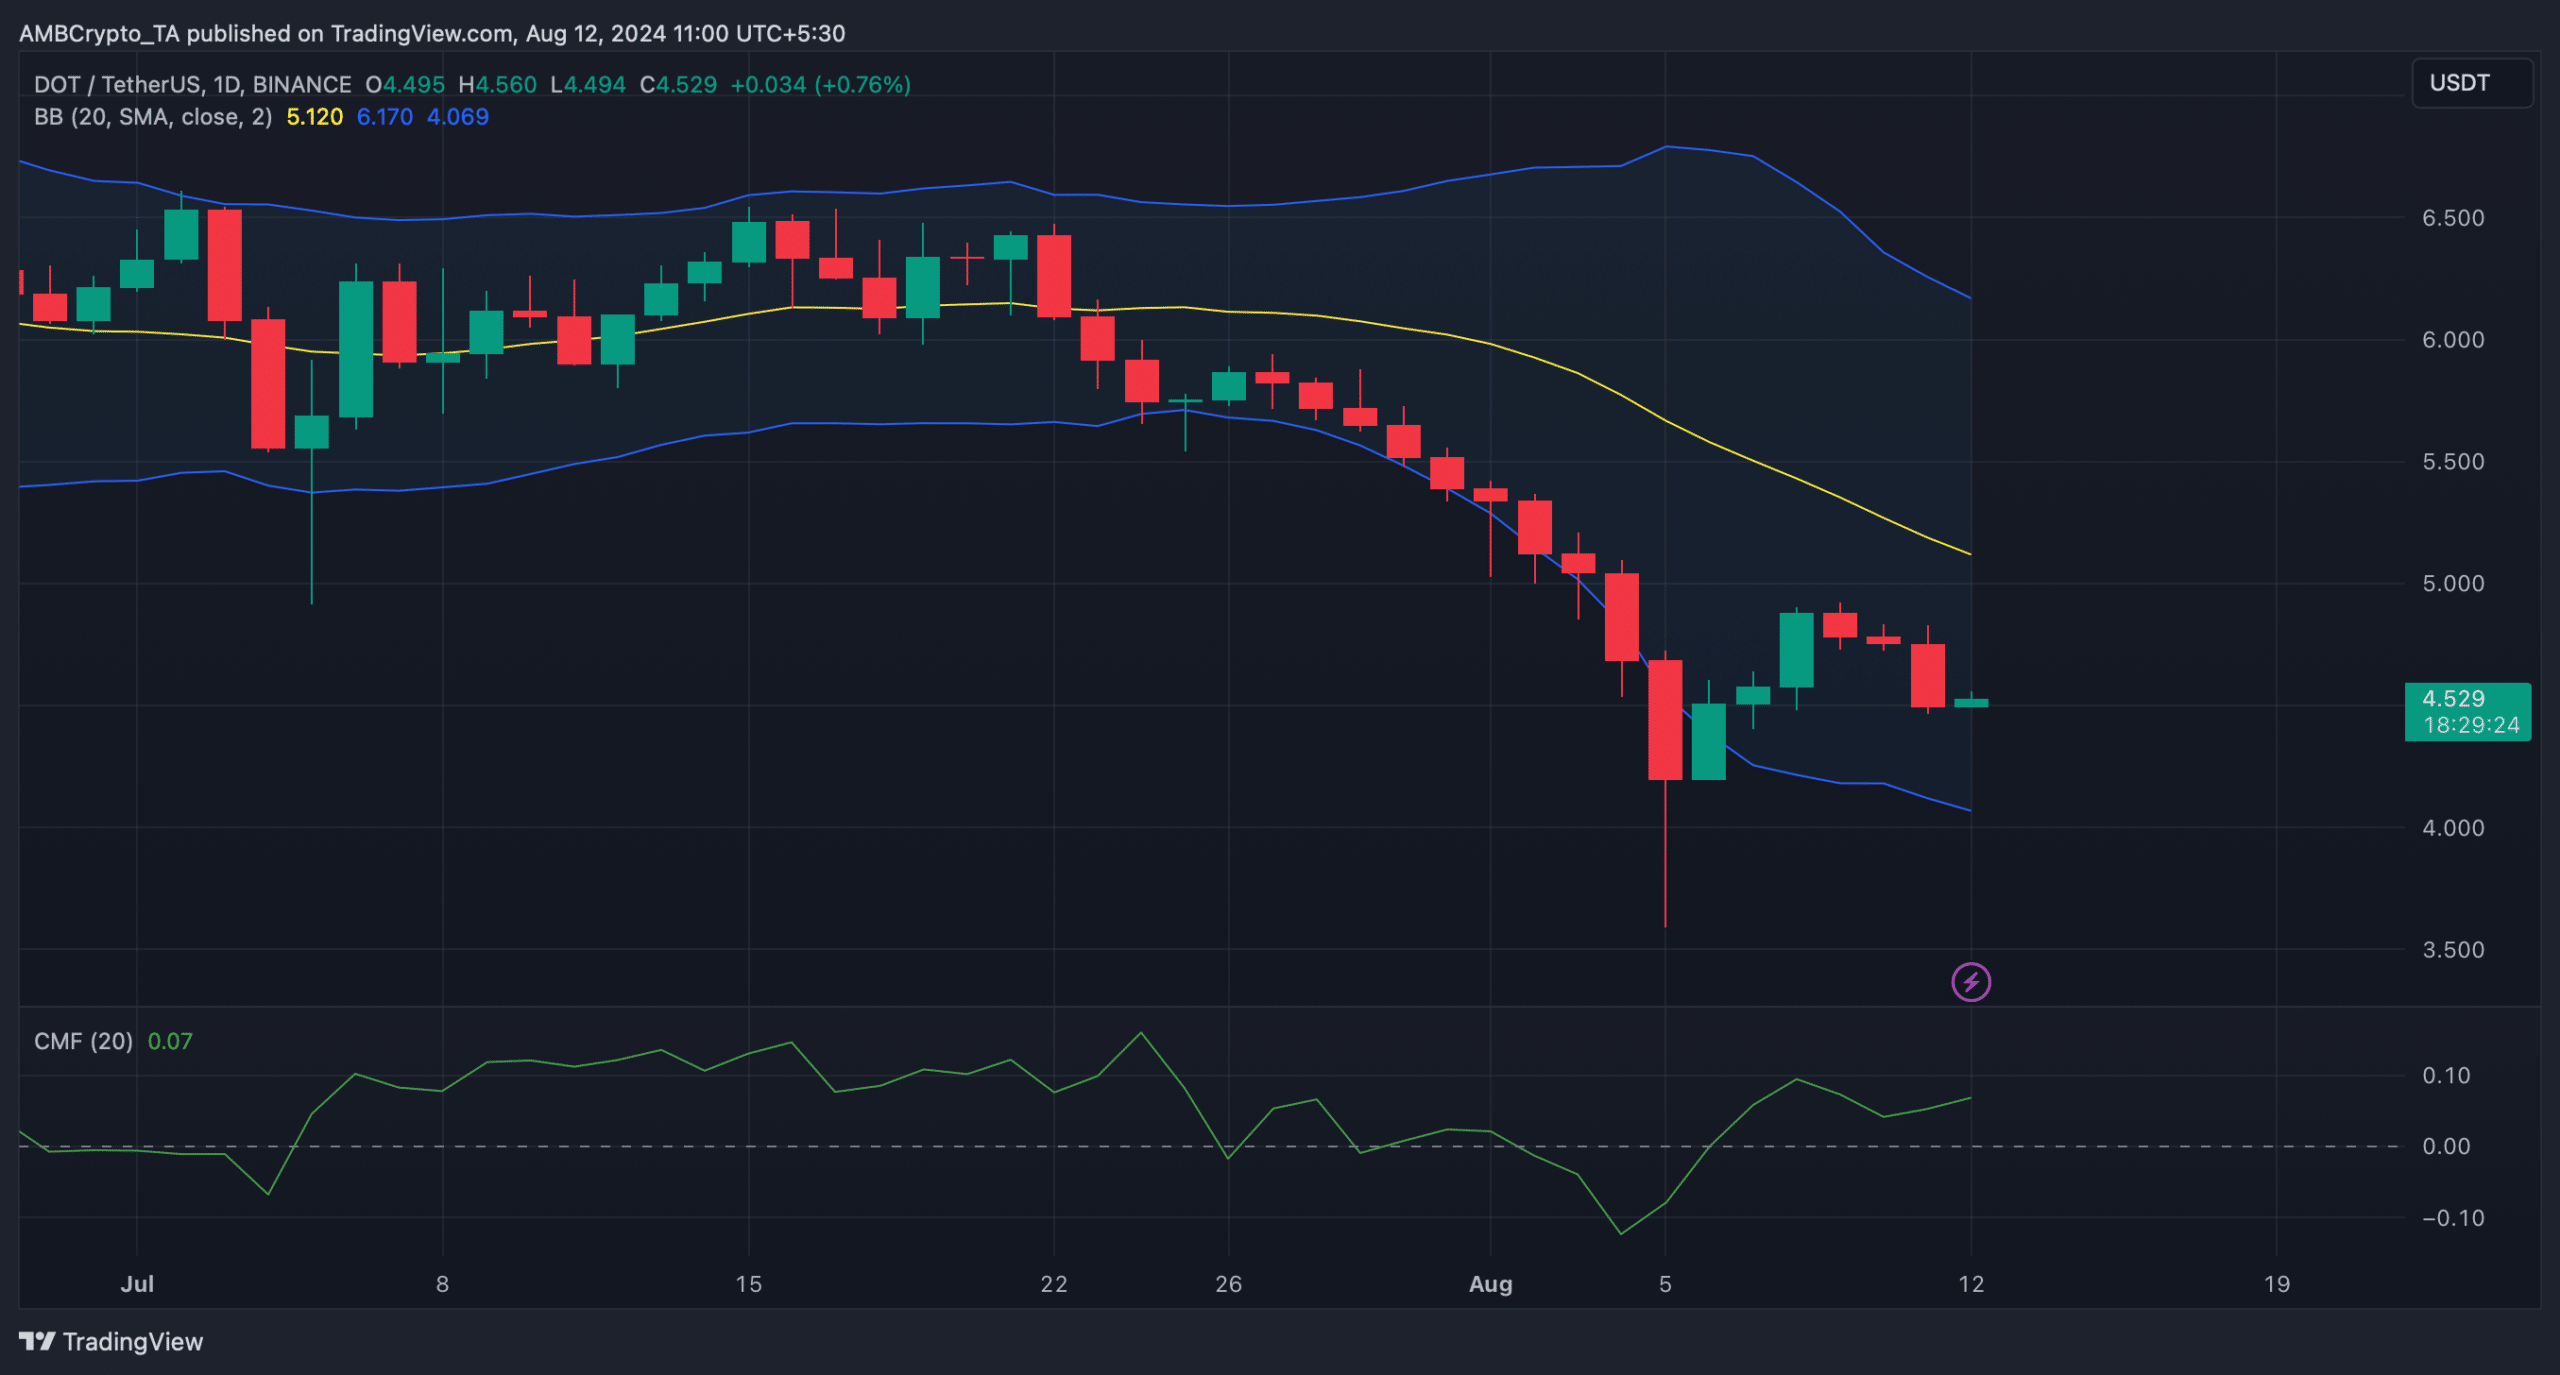
Therefore, AMBCrypto checked its daily chart to get a better understanding of what to expect. DOT price bounced back after touching the lower boundary of the Bollinger Bands.


Read Polkadot (DOT) Price Prediction 2024-2025


Additionally, Chaikin Money Flow (CMF) also saw an increase, which appears bullish.

If the token turns bullish, it must first test its resistance near its 20-day simple moving average (SMA). A break above this level could trigger a rally.
PeasPeas

Source: TradingView

Next: Can Ethereum Break the $2.8K Barrier? Market Indicators Say Yes!


Source link

Share. Facebook Twitter Pinterest LinkedIn Tumblr Email
Previous ArticlePolkadot targets $10: Falling wedge pattern on DOT chart means…
Next Article Solana’s July DEX Volume Surpasses Ethereum’s Amid Wash Trading Concerns

Related Posts

Bitcoin

Uniswap RFC explores running private exchanges using v4 and UniswapX hooks

July 30, 2026
Bitcoin

Kraken Cyprus honored at the 14th Invest Cyprus International Investment Awards

July 30, 2026
Bitcoin

Psalion launches $50M fund to support blockchain startups as Web3 adoption grows

July 29, 2026
Add A Comment
Leave A Reply Cancel Reply

Single Page Post
Share
  • Facebook
  • Twitter
  • Instagram
  • YouTube
Featured Content
Event

Dutch Blockchain Week 2026 strengthens position as Europe’s leading B2B blockchain event week

April 14, 2026

Amsterdam, April 2026 – Dutch Blockchain Week 2026 is rapidly evolving into one of Europe’s…

Event

Global Games Show Riyadh: The Ultimate Creator & Influencer Hub

March 31, 2026

The fast-evolving gaming ecosystem of Riyadh is powered by solid national investment, a flourishing esports…

1 2 3 … 82 Next
  • Facebook
  • Twitter
  • Instagram
  • YouTube

Australia targets Telegram a day after Russia indicts Durov

July 30, 2026

Ethena whales withdraw 102 million tokens from exchanges: has ENA selling pressure eased?

July 30, 2026

Audiera loses KEY support – can BEAT recover from 24% crash?

July 29, 2026
Facebook X (Twitter) Instagram LinkedIn
  • About us
  • Disclaimer
  • Terms of service
  • Privacy policy
  • Contact us
© 2026 Altcoin Observer. all rights reserved by Tech Team.

Type above and press Enter to search. Press Esc to cancel.

bitcoin
Bitcoin (BTC) $ 81,079.00
ethereum
Ethereum (ETH) $ 2,362.57
tether
Tether (USDT) $ 0.998838
bnb
BNB (BNB) $ 747.28
xrp
XRP (XRP) $ 1.33
usd-coin
USDC (USDC) $ 0.999401
solana
Solana (SOL) $ 102.27
tron
TRON (TRX) $ 0.331289
staked-ether
Lido Staked Ether (STETH) $ 2,265.05
figure-heloc
Figure Heloc (FIGR_HELOC) $ 1.03