- Over 8 million addresses are currently holding BTC below the current price level.
- BTC remained below the $60,000 price level.
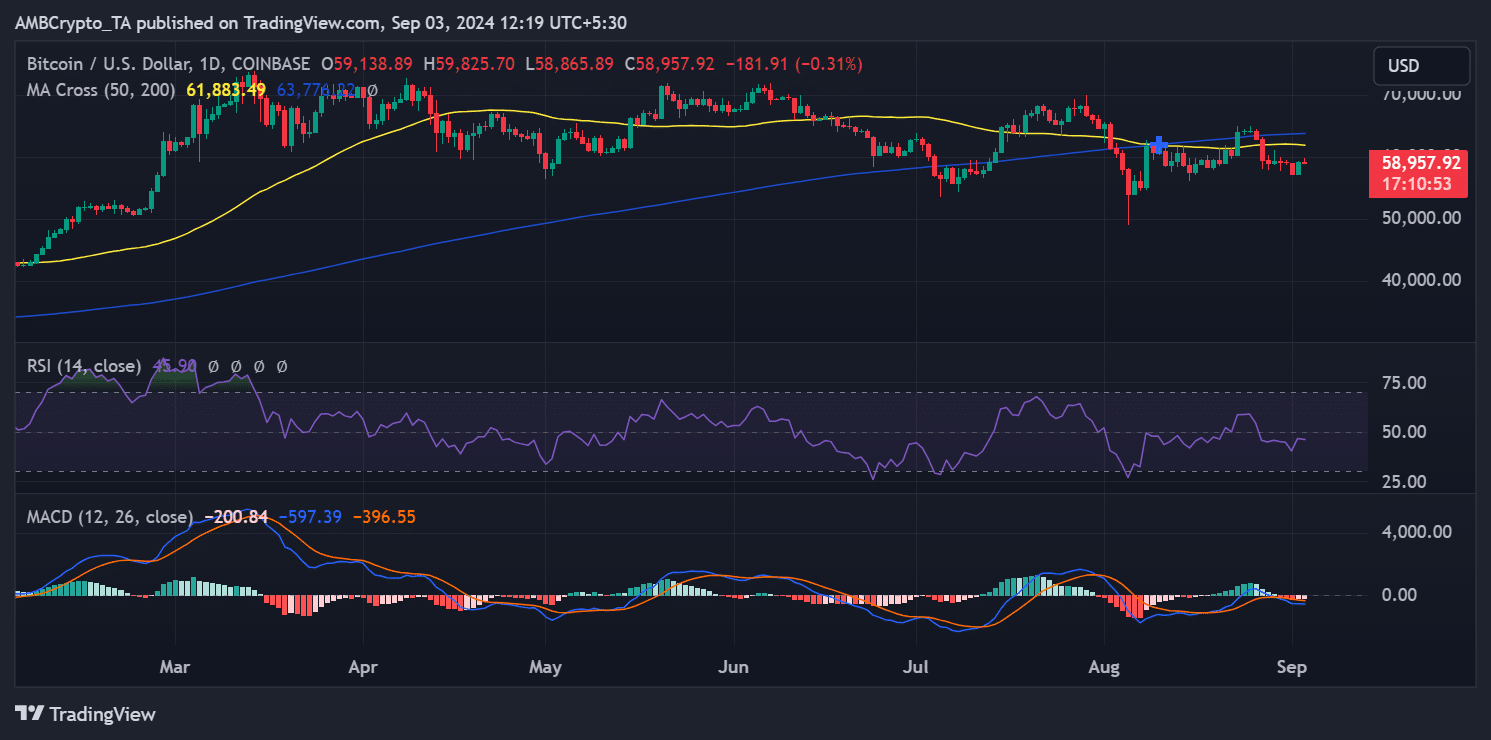
Bitcoin (BTC) has seen significant price volatility over the past few weeks, with its chart showing a trend where the price is rising towards the $60,000-$61,000 range, only to decline shortly after.
Analysis suggests that the main factor behind this behavior is the large number of holders currently at a loss.
Bitcoin continues to fall
Recent Bitcoin price chart analysis reveals a trend of constant volatility around the $60,000 price range. On August 27, Bitcoin fell from the $60,000 level, starting the day at around $62,840 and closing at around $59,433.
Since then, Bitcoin has struggled to reclaim the $60,000 mark, although it has occasionally reached that level during various trading sessions.


Source: TradingView
In the following sessions, the highest price reached by Bitcoin was around $59,000, but it quickly declined from this range. At the end of the most recent trading session, Bitcoin closed at around $59,139 after a 3% increase.
However, at the time of writing, Bitcoin has once again fallen below the $59,000 mark, reflecting the continued trend seen over the past few weeks.
This repeated failure to sustain an uptrend at or above $60,000 suggests an important resistance level at this price level.
The main reason why Bitcoin has not been able to maintain this upward trend is the increased selling pressure every time the price approaches or exceeds the $60,000 range.
As the price of Bitcoin rises, many holders, especially those who bought at higher prices, may choose to sell to break even or lock in their profits.
This selling activity generates downward pressure, preventing the price from sustaining above these key levels.
Sellers put more pressure on BTC
A recent analysis of data from IntoTheBlock sheds light on why Bitcoin is struggling to reach and maintain the $60,000 price range.
The Global In/Out of the Money chart reveals that a significant number of addresses purchased Bitcoin at higher price levels, particularly in the $61,705 to $72,500 range.
Specifically, the chart shows that over 6.9 million addresses purchased Bitcoin in this price range.
Additionally, another large group of holders purchased BTC at prices between $59,000 and $61,000, totaling around 1.7 million addresses. This means that over 8.6 million addresses, representing around 16.08% of all BTC holders, are currently holding their BTC at a loss.
This concentration of losing holders explains the difficulty BTC has had in breaking and maintaining the $60,000 price range in recent weeks.
When the price of BTC approaches or exceeds these levels, many of these holders may be inclined to sell their holdings to recover their investments or minimize their losses.
This selling pressure creates a significant barrier, preventing BTC from maintaining upward momentum above the $60,000 mark.
What Bitcoin Needs to Break Resistance
The large number of addresses holding losses acts as a psychological resistance level. As Bitcoin approaches these price levels, the market experiences massive sell-offs, which pushes the price down.
This pattern is one of the main reasons why BTC has been unable to establish a stable uptrend in recent weeks, despite reaching the $60,000 level at times during trading sessions.
For BTC to break through this resistance and sustain higher price levels, the market would need to absorb this selling pressure.
This could happen if there is a significant influx of new buyers willing to purchase Bitcoin at these levels or if market sentiment changes in a way that encourages holders to hold their positions rather than sell.
Read Bitcoin (BTC) Price Prediction 2024-25
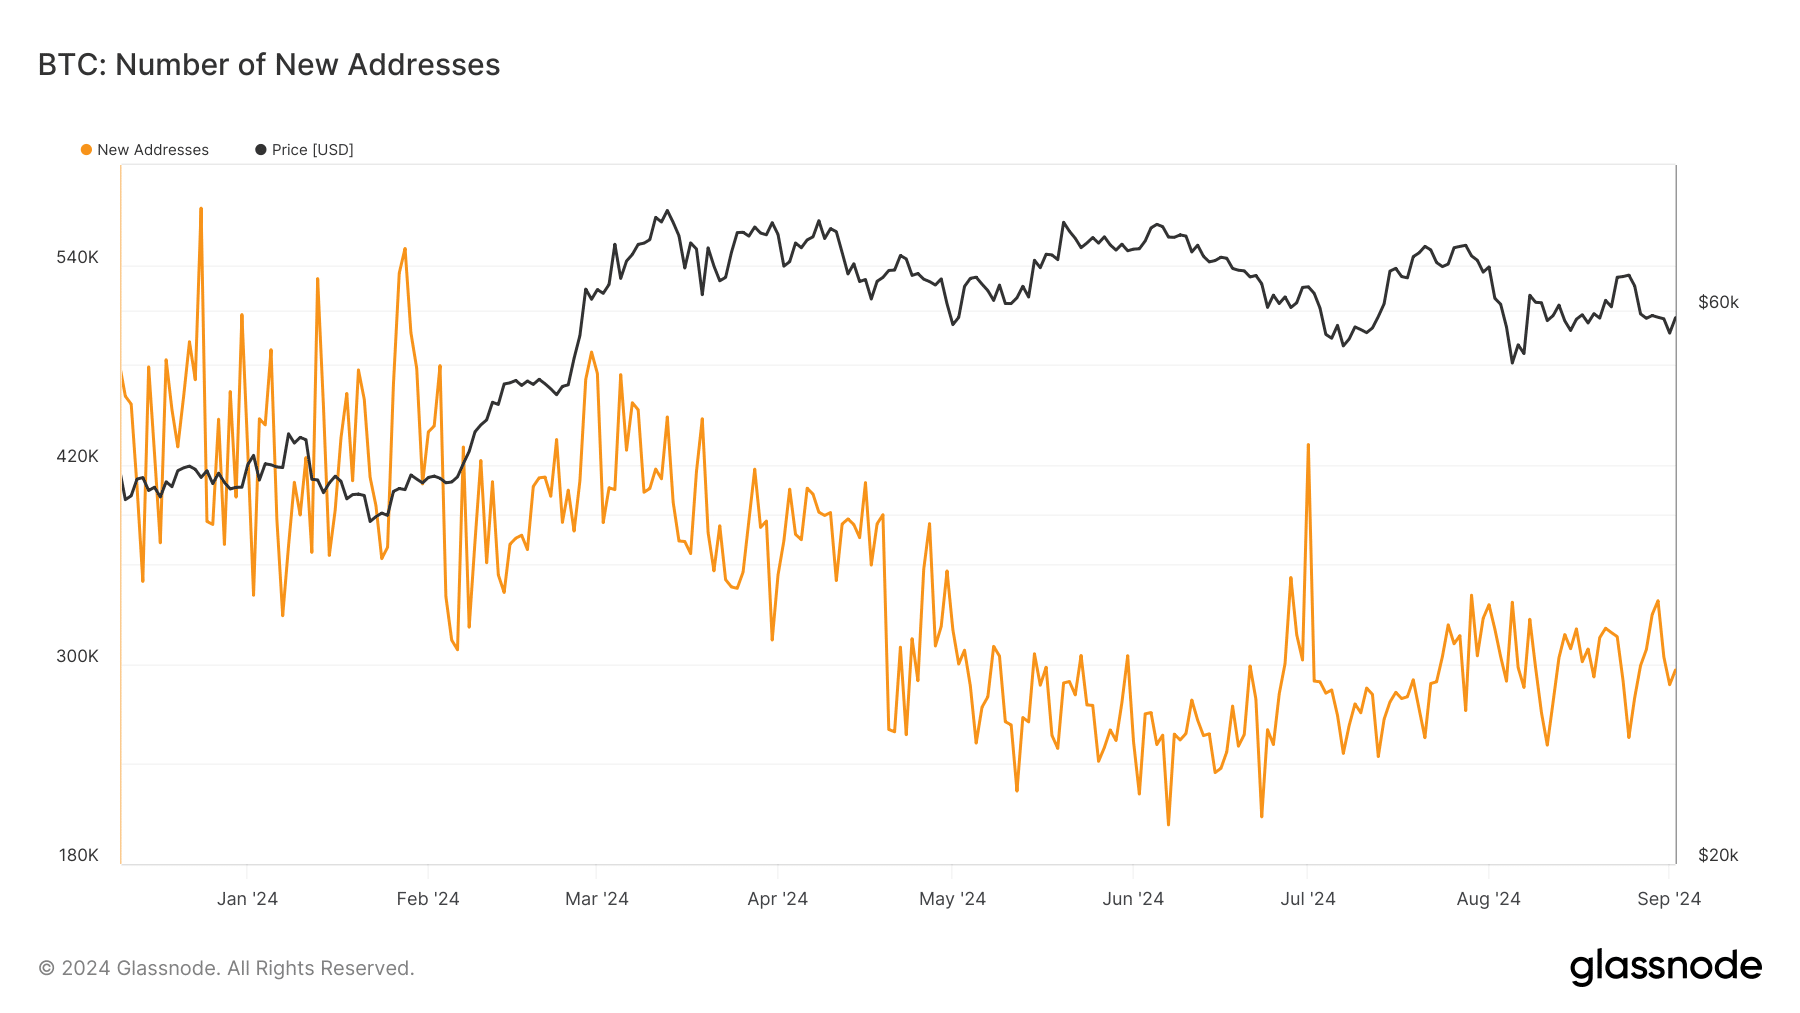
Additionally, a recent analysis of the trend of new Bitcoin addresses reveals a sharp decline in the number of new daily addresses. According to Glassnode data, the number of new addresses dropped significantly after August 30, from around 338,000 to around 287,000.
As of this writing, the number of new addresses has recovered slightly to around 296,000.


Source: Glassnode


