




Ethereum price began a further decline below $3,750. ETH drops below $3,700 and could fall further if it trades below $3,550.
- Ethereum sparked another bearish wave after failing to clear $3,880.
- The price is trading below $3,700 and the 100 hourly simple moving average.
- There is a contracting triangle forming with resistance at $3,650 on the ETH/USD hourly chart (data feed via Kraken).
- The pair could continue to decline if it trades below $3,550.
Ethereum price falls further
Ethereum price failed to stay in a positive zone and started a further decline below $3,880, similar to Bitcoin. ETH price fell below $3,800 and $3,750 to enter a bearish zone.
The decline accelerated below $3,650. Eventually, the bulls appeared near $3,550. A low formed at $3,557 and the price is now consolidating its losses near the 23.6% Fibonacci retracement level of the recent decline from the $3,920 high to $3,557 low.
Ethereum price is now trading below $3,800 and the 100 hourly simple moving average. In case of a recovery wave, the price could face resistance near the $3,650 level. There is also a contracting triangle forming with resistance at $3,650 on the ETH/USD hourly chart.
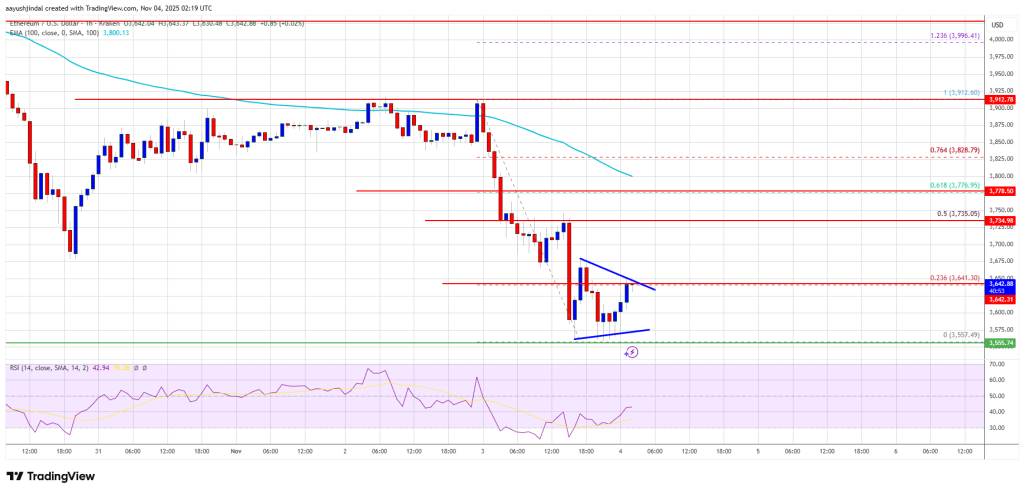
The next key resistance is near the $3,740 level and the 50% Fibonacci retracement level of the recent decline from the $3,920 high to $3,557 low. The first major resistance is near the $3,800 level. A sharp move above the $3,800 resistance could push the price towards the $3,880 resistance. A bullish break above the $3,880 region could lead to more gains in the coming sessions. In the presented case, Ether could reach the resistance zone of $4,000 or even $4,050 in the short term.
More losses in ETH?
If Ethereum fails to clear the $3,800 resistance, it could begin a further decline. Initial downside support is near the $3,580 level. The first major support lies near the $3,550 area.
A sharp move below the $3,550 support could push the price towards the $3,500 support. Any further losses could push the price towards the $3,420 region in the near term. The next key support lies at $3,350 and $3,320.
Technical indicators
Hourly MACD – The MACD for ETH/USD is gaining momentum in the bearish zone.
Hourly RSI – The RSI for ETH/USD is now below the 50 zone.
Major Support Level – $3,550
Major Resistance Level – $3,800


