



Close Menu
Altcoin ObserverAltcoin Observer
  • Regulation
  • Bitcoin
  • Altcoins
  • Market
  • Analysis
  • DeFi
  • Security
  • Ethereum
Categories
  • Altcoins (3,732)
  • Analysis (3,840)
  • Bitcoin (4,470)
  • Blockchain (2,157)
  • DeFi (2,623)
  • Ethereum (2,773)
  • Event (119)
  • Exclusive Deep Dive (1)
  • Landscape Ads (2)
  • Market (2,714)
  • Press Releases (12)
  • Reddit (2,847)
  • Regulation (2,474)
  • Security (4,103)
  • Thought Leadership (3)
  • Videos (44)
Hand picked
  • Uniswap RFC explores running private exchanges using v4 and UniswapX hooks
  • Australia targets Telegram a day after Russia indicts Durov
  • Bitcoin’s weak hands fold
  • Success Story: Jonathan Nichols’ Learning Journey with 101 Blockchains
  • Kraken Cyprus honored at the 14th Invest Cyprus International Investment Awards
We are social
  • Facebook
  • Twitter
  • Instagram
  • YouTube
Facebook X (Twitter) Instagram
  • About us
  • Disclaimer
  • Terms of service
  • Privacy policy
  • Contact us
Facebook X (Twitter) Instagram YouTube LinkedIn
Altcoin ObserverAltcoin Observer
  • Regulation
  • Bitcoin
  • Altcoins
  • Market
  • Analysis
  • DeFi
  • Security
  • Ethereum
Events
Altcoin ObserverAltcoin Observer
Home»Ethereum»Ethereum’s Fall Could Be Over: This Key Pattern Signals a Return to $4,000
Ethereum

Ethereum’s Fall Could Be Over: This Key Pattern Signals a Return to $4,000

September 9, 2024No Comments
Share Facebook Twitter Pinterest LinkedIn Tumblr Reddit Telegram Email
Dall·e 2024 09 04 17.05.46 A Digital Illustration Showing Ethereums Potential Rally Back To 4000 Bas.jpeg
Share
Facebook Twitter LinkedIn Pinterest Email


Much like Bitcoin, Ethereum has faced significant challenges in recent months, struggling to sustain a major price rally. After peaking at over $4,000 in March, Ethereum has been falling steadily, failing to break out of this bearish trend.

So far, the second-largest cryptocurrency by market cap has seen its price drop by over 5.9% in the past two weeks and continues to hover around $2,400. Currently trading at $2,434, Ethereum has dropped 2.4% in the past week and 0.4% in the past 24 hours.

Is a bounce to $4,000 imminent?

Despite the slowdown, market analysts remain optimistic about a possible turnaround. According to a recent article by “The Moon” on X, Ethereum could be ready to rally to $4,000, if certain technical conditions are met.

In particular, The Moon highlighted Ethereum’s current 1D Falling Wedge formation, a common chart pattern in technical analysis that often indicates a potential reversal. The analyst said, “Once a breakout occurs, there is a strong possibility that Ethereum will rally back to $4,000.”
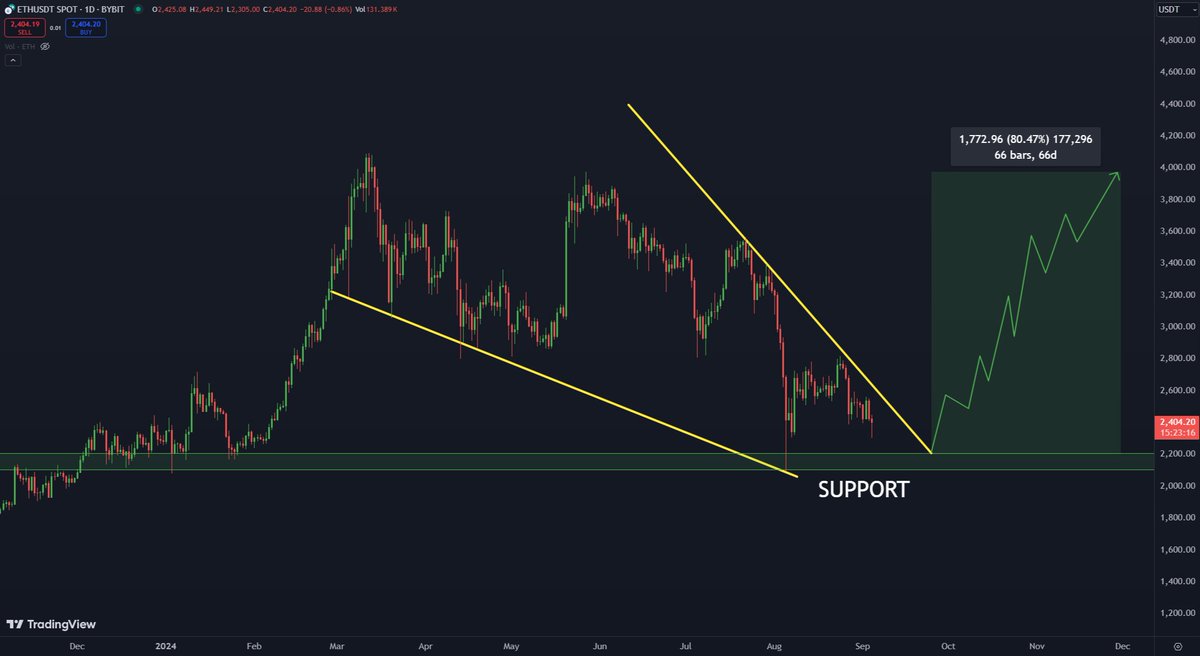
Face to Face Wedge Pattern on Ethereum Chart

To put things into context, a falling wedge in technical analysis is a pattern in which the price of an asset is in a downtrend but within an increasingly narrowing range.

This pattern usually suggests that the downward momentum is weakening and that once the price breaks above the wedge, a reversal could occur. This is what The Moon predicts for Ethereum: a possible breakout could lead to a return to previous highs.

Ethereum (ETH) price chart on TradingView

Ethereum Sees Rising Bullish Sentiments

Meanwhile, other analysts in the crypto community have shared similar bullish sentiments about Ethereum’s future performance. Popular crypto analyst Crypto Jack pointed out that Ethereum’s price is approaching a key long-term support level.

Jack said a rebound from $2,200 could signal a strong reversal and potentially lead to an uptrend. This long-term support level could be crucial for Ethereum as it attempts to regain momentum after weeks of lackluster performance.

The price of $ETH is approaching long-term support.

A rebound of $2.2k for #Ethereum This could be extremely optimistic. pic.twitter.com/pepeDZm5FA

— CryptoJack (@cryptojack) September 4, 2024

Crypto analyst Mags, who recently noted on X that Ethereum is currently trading inside a massive triangle pattern, reinforces the bullish outlook.

According to Mags, this formation, combined with the possibility of a double bottom near the ascending trendline, could signal that Ethereum is ready for a significant upward move.
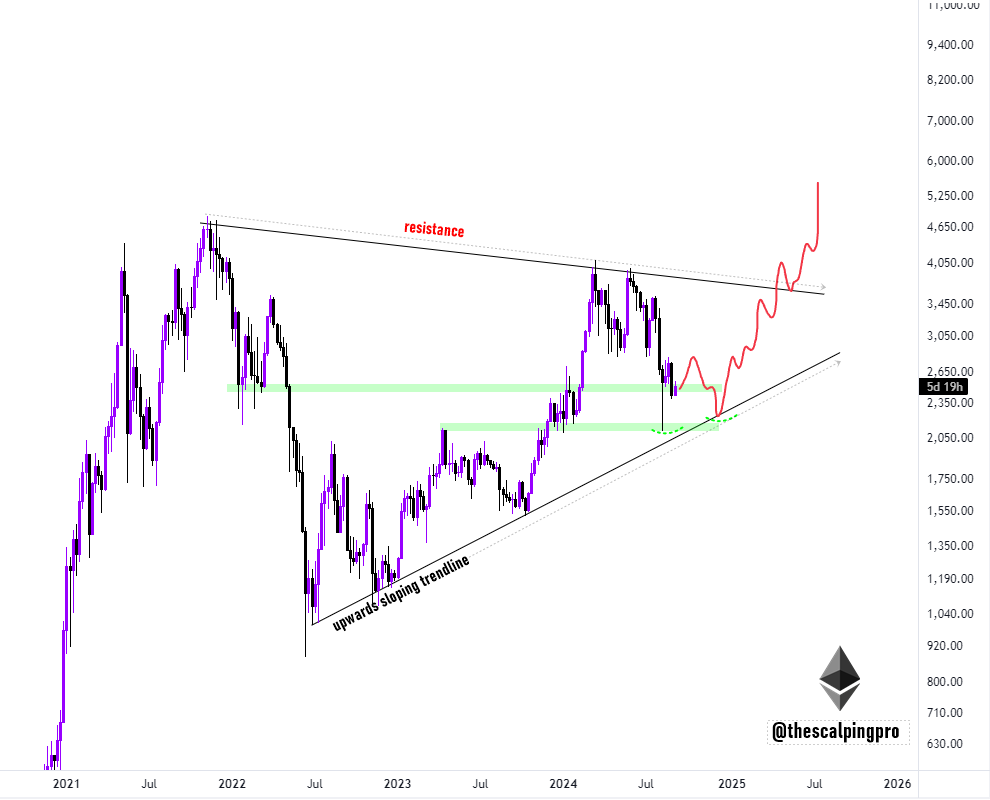
Ethereum chart.

A double bottom occurs when an asset forms two lows at approximately the same price level, indicating strong support and the potential for a bullish reversal.

Featured image created with DALL-E, chart by TradingView


Source link

Share. Facebook Twitter Pinterest LinkedIn Tumblr Email
Previous ArticleImportant context behind ASIC’s recent ruling and why Australia should prioritise implementing a clear crypto regulatory framework
Next Article Trump’s Crypto Venture WLFI Is a ‘Huge Mistake,’ Investor Says

Related Posts

Ethereum

Ethereum Foundation Board Update | Ethereum Foundation Blog

July 30, 2026
Ethereum

Morgan Stanley uses $7.4 trillion in client assets and minimal fees to hijack Wall Street’s crypto boom

July 29, 2026
Ethereum

On-chain data shows 5,280 ETH flowing to single address following quiet Triple-A wallet breach

July 27, 2026
Add A Comment
Leave A Reply Cancel Reply

Single Page Post
Share
  • Facebook
  • Twitter
  • Instagram
  • YouTube
Featured Content
Event

Dutch Blockchain Week 2026 strengthens position as Europe’s leading B2B blockchain event week

April 14, 2026

Amsterdam, April 2026 – Dutch Blockchain Week 2026 is rapidly evolving into one of Europe’s…

Event

Global Games Show Riyadh: The Ultimate Creator & Influencer Hub

March 31, 2026

The fast-evolving gaming ecosystem of Riyadh is powered by solid national investment, a flourishing esports…

1 2 3 … 82 Next
  • Facebook
  • Twitter
  • Instagram
  • YouTube

Australia targets Telegram a day after Russia indicts Durov

July 30, 2026

Ethena whales withdraw 102 million tokens from exchanges: has ENA selling pressure eased?

July 30, 2026

Audiera loses KEY support – can BEAT recover from 24% crash?

July 29, 2026
Facebook X (Twitter) Instagram LinkedIn
  • About us
  • Disclaimer
  • Terms of service
  • Privacy policy
  • Contact us
© 2026 Altcoin Observer. all rights reserved by Tech Team.

Type above and press Enter to search. Press Esc to cancel.

bitcoin
Bitcoin (BTC) $ 80,696.00
ethereum
Ethereum (ETH) $ 2,338.52
tether
Tether (USDT) $ 0.998713
bnb
BNB (BNB) $ 753.68
xrp
XRP (XRP) $ 1.31
usd-coin
USDC (USDC) $ 0.999273
solana
Solana (SOL) $ 101.53
tron
TRON (TRX) $ 0.331335
staked-ether
Lido Staked Ether (STETH) $ 2,265.05
figure-heloc
Figure Heloc (FIGR_HELOC) $ 1.03