


XRP is now back to trading just above the $2 level after an early January rally briefly focused on prices in the $2.40 range. Withdrawal has so far been controlledwith price holding above former resistance which has now turned into short-term support.
Technical analysis shared on This outlook focuses on how XRP reacts with the US Dollar Index and what its next move could mean for the cryptocurrency.
Related reading
How DXY Weakness Has Always Unlocked XRP Rallies
Bird analysis is based on the US Dollar Index, or DXY, and its inverse relationship with XRP during important phases. The chart accompanying his message noted three previous periods, around 2017, 2021, and 2024, where sustained dollar weakness coincided with aggressive bullish movements in XRP.
During each of these cycles, red candles on the DXY chart caused the dollar to lose strength, while XRP responded with a strong upward expansion shortly after. This recurring pattern means that XRP’s largest movements tend to follow macroeconomic changes, not just XRP-related events. When dollar dominance fades, capital always shifts to crypto assets, and XRP has been a major beneficiary of this transition.
Interestingly, the current pattern shows that DXY has returned to a similar structural zone as seen before past reversals. As shown in the chart below, the DXY is now trending downward.
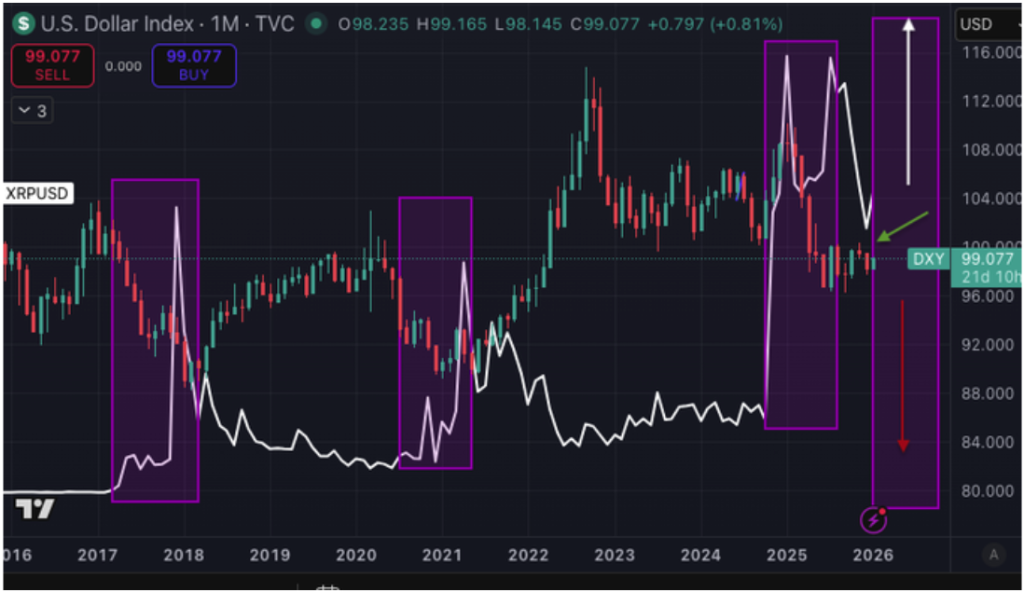
US Dollar Index, XRPUSD. Source: @Bird_XRPL on
XRP towards new all-time highs?
The first highlighted phase captures the cycle from late 2017 to early 2018, when a weakening dollar backdrop aligned with XRP’s rally to the cycle peak in the mid-$3 range.
A similar relationship emerged around the 2020-2021 window, where dollar weakness was followed by XRP rising to $1.90 at the peak of its cycle. The latest was in the first half of 2025, which peaked when XRP hit its current all-time high of $3.65 in July.
The important context is why the current the moment is a decision point. At the time of writing, the DXY is sitting around 99, and from there it can either go lower and start printing red candles again, or enter a bid and print green.
If DXY starts printing red candles again and turns around, the pattern indicated by Bird suggests that the macroeconomic backdrop becomes favorable for another strong rise in XRP, hence a new all-time high above $3.65. could appear in the coming months.
Related reading
If the DXY shows green and strengthens, it would be the opposite signal: it can tighten liquidity conditions and keep XRP price action capped in consolidation around $2 before any breakout attempt. Either way, the dollar’s next move will indicate what comes next.
Featured image from Unsplash, chart from TradingView