


The broader crypto market is under severe pressure today, with Bitcoin, Ethereum and XRP posting steep losses as a broad sell-off sweeps digital assets. Bitcoin fell almost 6%, while Ethereum and XRP fell almost 7%, marking one of the most aggressive declines in recent weeks.
The decline quickly shifted from an orderly sell-off to a liquidation-driven rout. As leverage accumulated during previous consolidation phases was unwound, prices almost simultaneously fell below critical technical levels. This failure triggered forced liquidations, accelerating losses and pushing risk-aversion sentiment firmly.
Liquidation Wave Accelerates as Fed Uncertainty, Geopolitical Risks Hit Crypto
Strong cryptocurrency selling accelerated today as macroeconomic pressure intensified in global markets, with policy uncertainty from the Federal Reserve and rising geopolitical tensions acting as key catalysts behind the selloff wave.
Markets turned away from risk after fresh signals that U.S. interest rates could stay high for longer, dampening expectations of near-term monetary easing. At the same time, escalating geopolitical tensions have added to broader market anxiety, pushing investors away from high-risk assets such as cryptocurrencies.
This macroeconomic shock hit an already overleveraged crypto market. Once Bitcoin fell below key technical levels, forced liquidations quickly took control of price action. Derivatives data shows that more than $1.2 billion in crypto positions were liquidated in a short period of time, with long positions accounting for the overwhelming majority of losses.
- Bitcoin Liquidations: Around $788 Million
- Ethereum Liquidations: Around $423 Million
- XRP Liquidations: Around $71 Million
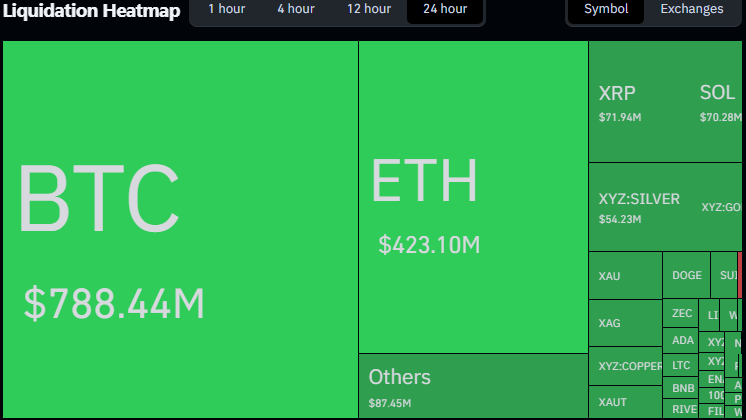
More than 90% of liquidations came from long positions, confirming that bullish bets had become overcrowded near recent highs. Once prices moved against these positions, the liquidation amplified losses on the exchanges, accelerating the downward momentum.
Bitcoin Price Analysis: Breakout Signals Signal Further Downside Ahead
The Bitcoin price chart structure has turned definitively bearish. For several months, it was capped within a range, but today it broke the range with strong volumes, highlighting a break. The trendline breakout along the $87,000 horizontal support zone implies strong structural weakness on the daily chart. This rupture invalidates the higher-lower structure and signals a shift to distribution rather than accumulation.
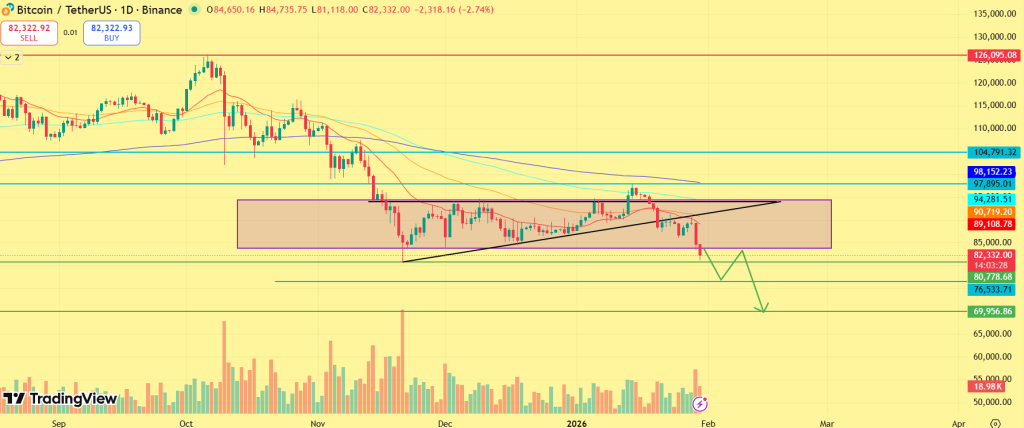
Now, Bitcoin price is trading at $82,000, below the support zone and short-term moving averages, with volume rising to the downside, implying weakness. If Bitcoin price fails to quickly reclaim the $87,000 region, downside risk remains active towards $80,000, with the structure allowing for an extended move towards $75,000 in the near term.
Ethereum Price Analysis: Loss of $2,800 Support Reinforces Bearish Bias
Ethereum price chart confirms increasing downside risk after a clear break from the $2,800 support zone. This level has acted as a key demand area during several pullbacks, but sellers exceeded bids during the latest selloff. Currently, ETH price is now trading below a compressed consolidation range, with the breakout occurring alongside increasing liquidation volume. Former support around $2,800 has turned into resistance, reinforcing the bearish bias.
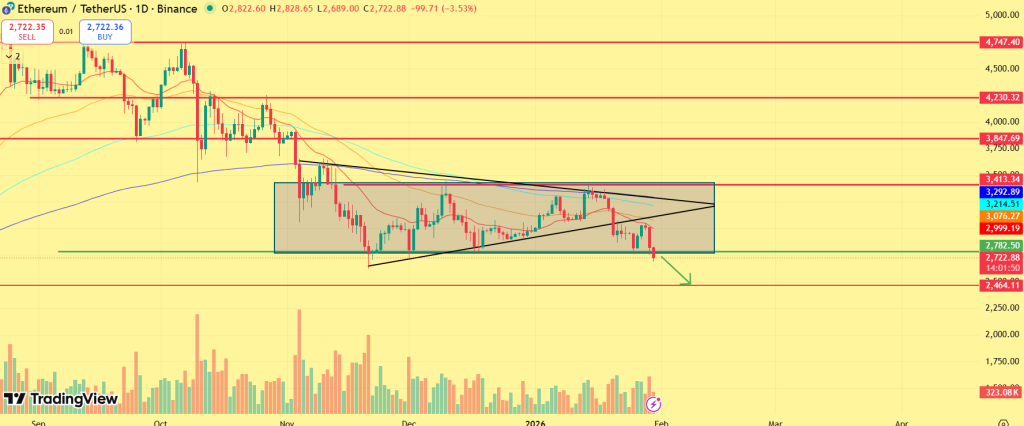
The next major demand area is between $2,500 and $2,400, where historical accumulation and ETF-related flows have emerged previously. Until ETH decisively reclaims $2,800, any bounce will likely remain constructive rather than reversing the trend.
- Read also:
- Why Gold and Silver Prices Crashed Today and How It Drove Bitcoin Down
- ,
XRP Price Analysis: Failure of Support Confirms Continued Downside
The XRP price chart structure also indicates further decline as it has fallen below a long support base and is heading towards the lower $1.40 channel region, implying a bearish continuation. XRP price remains trapped in a descending channel with lower highs and lower lows. With the demand weakening and the loss of the support zone, the downside risk is now increasing. The lack of accumulation suggests broader risk aversion towards altcoins, making XRP vulnerable to continued selling pressure.
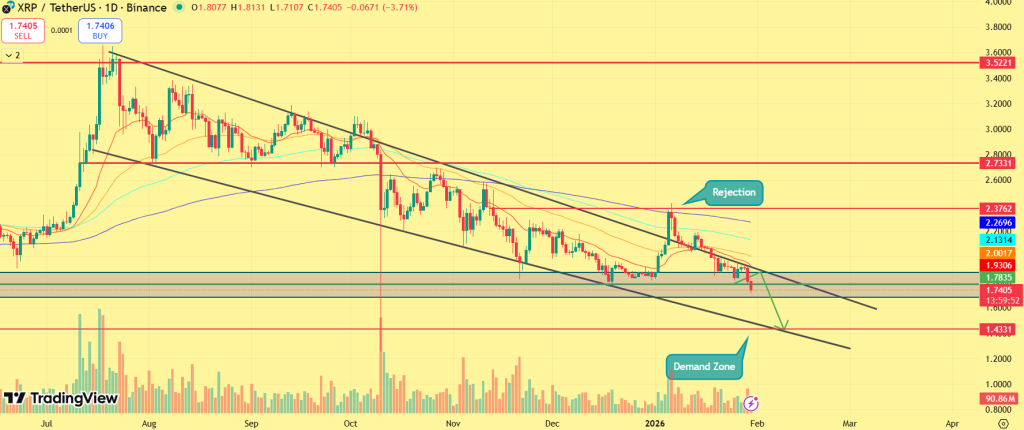
In early 2026, XRP price received a strong rejection from $2.40 and buyers trapped. Subsequently, continued selling pressure forced buyers to exit their positions, leading to a sharp decline. Until XRP price remains above $2, the bearish structure continues to push XRP towards the lower regions.
Market Outlook: Why Selling is Accelerating
The current sell-off reflects the convergence of a fragile technical structure, high leverage and a weakening appetite for macro risk. Following the Federal Reserve’s latest policy guidance, markets have reassessed their expectations for liquidity and lower rates, putting pressure on speculative assets across the board. Even though forced selling has reduced some excess positioning, price action suggests the reset is still underway. The recovery depends on Bitcoin recovering to between $87,000 and $88,000, Ethereum recovering from $2,800, and XRP recovering from its broken base. Until these levels are regained, volatility is likely to remain high, with the recovery driven by supply rather than the attraction of new risk capital.
FAQs
The crypto is down due to forced liquidations, uncertainty over Fed rates, geopolitical tensions and weakening investor risk appetite.
Bitcoin is down about 6%, Ethereum and XRP are down almost 7%, due to a broad market sell-off and liquidation events.
Overleveraged long positions, falling below key support levels, triggered over $1.2 billion in rapid liquidations across major coins.
Recovery depends on the recovery of key support for Bitcoin, Ethereum and XRP. Until then, volatility and downside pressure remain high.