




XRP is in a squeeze phase rather than breakdown, according to analyst EGRAG CRYPTO, who says the chart’s biggest trigger now sits at $2.20. In an article published Friday, he said that returning to this level would mark the point where the current structure would once again become resolutely constructive.
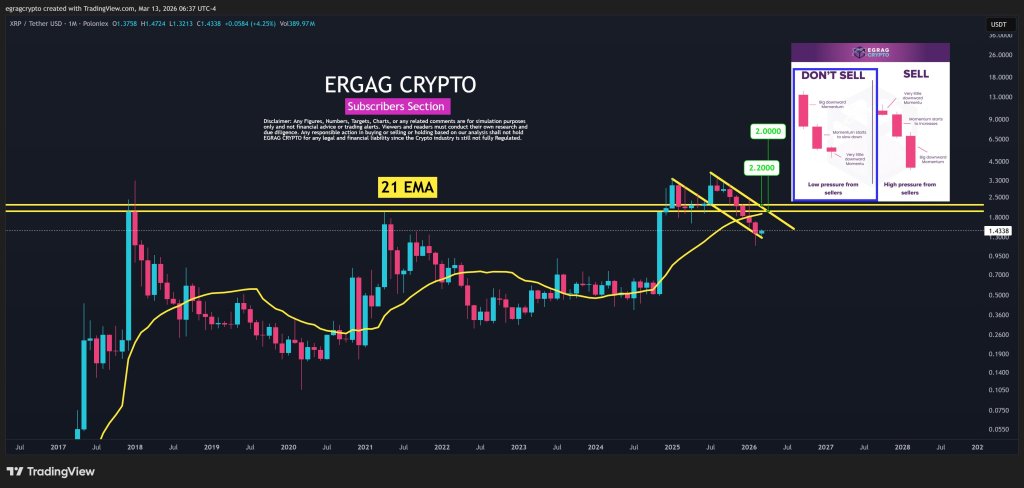
EGRAG’s analysis is built around the monthly XRP chart and, more specifically, the 21-period exponential moving average. “I keep repeating this: I don’t predict the future. I read charts, I study cycles, and I use indicators,” he wrote, describing the pattern less as a directional call and more as a structural reading of the market. “Right now, the 21 EMA is the key.”
What does this mean for XRP price
On its chart, this yellow 21 EMA has served as a central tendency reference across several XRP cycles. The latest monthly candles show the price slipping below this line after a strong rally, then moving into what it describes as a “descending/descending compression channel.” He paired this with another key observation: “Price lost the 21 EMA,” “formed a downward compression/bearish channel,” and was “rejected from the $2.20 macro zone.” His conclusion from this combination was straightforward: “It is not a rugged structure. »
Related reading
This distinction is at the heart of the thesis. Rather than interpreting the recent decline as a broad capitulation, EGRAG asserts that the candles’ behavior indicates a controlled retracement. “Look at the candles: bodies are shrinking, bearish momentum is weakening, the retracement is controlled,” he wrote. “It’s seller burnout, not collapse.”
The graph visually supports this reading. The candles on the right side of the pattern are smaller than during the previous impulse move, and the decline appears more contained than impulsive. The descending yellow guidelines drawn during recent price action show a narrowing channel rather than a steep vertical unwind. In practical terms, the configuration looks like a squeeze at a decision point, not an outright structural failure.
EGRAG then mapped out two possible paths from there. The first is what he called a “liquidity-first sweep,” meaning “a final reshuffle toward $0.80-1.00.” According to him, this scenario would reflect a “measured wedge movement and lower liquidity,” suggesting that XRP could still dip towards the lower part of the structure before any attempt at a broader reversal.
Related reading
The second path is the most immediate bullish alternative. “Fast Reclaim,” he wrote, would come “if XRP recovers $1.65 to $1.80,” in which case “the structure will become bullish again.” This recovery zone is important because it would indicate that the squeeze has failed to produce a follow-up to the downside and that buyers are regaining control ahead of a deeper push.
However, the most important level on the chart is higher up. EGRAG is explicit on this point: “The level that changes everything $2.20: recover this level and the expansion phase reactivates. ” He followed that with the roadmap above: “Next goals: $2.20 recovery, $2.50 retest. »
That’s $2.20 more than just a nearby resistance band. According to this reading, this is the macroeconomic pivot separating a still unresolved correction from a new phase of expansion. The analyst had already identified it as the area where XRP had previously been rejected, so a return above would not only recover lost ground; this would invalidate the idea that the market remains stuck below a failed breakout zone.
For now, his message is that the market remains in wait-and-see mode. “In the meantime… This is a squeeze, not a capitulation,” EGRAG wrote. “Structure > Noise”.
At press time, XRP was trading at $1.41.
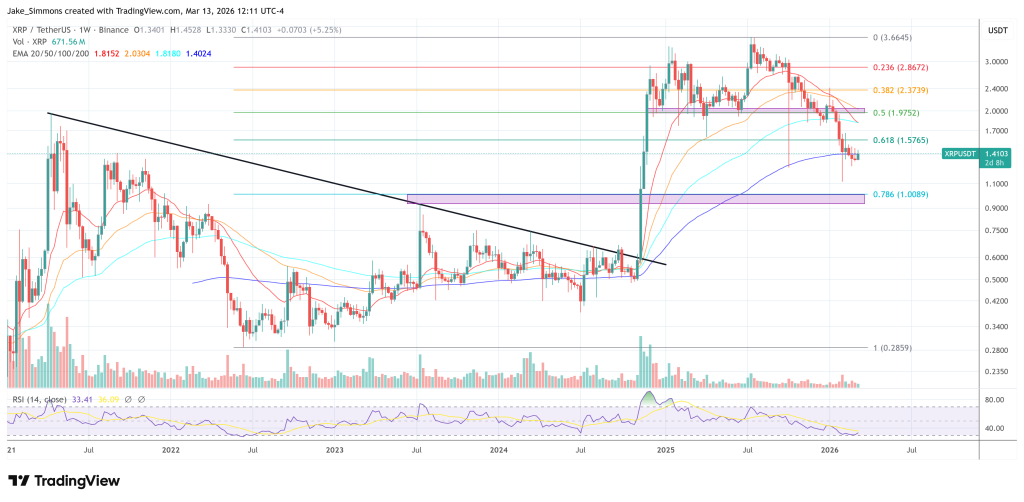
Featured image created with DALL.E, chart from TradingView.com


