


Ethereum price has started a steady recovery wave above $2,000. ETH is now consolidating above $2,050 and could eye more gains.
- Ethereum started a decent rise from the $1,935 area.
- The price is trading above $2,020 and the 100 hourly simple moving average.
- There was a break above a key downtrend line with resistance at $2,060 on the ETH/USD hourly chart (data feed via Kraken).
- The pair could begin a further decline if it remains below the $2,150 resistance.
Ethereum price attempts to recover
Ethereum price failed to stay above $2,050 and extended losses, like Bitcoin. ETH price fell below $2,020 and $2,000 to enter a bearish zone.
Eventually, the bulls appeared near $1,935. A low was formed at $1,936 and the price is now recovering its losses. There was a move above the $2,050 resistance. The price crossed the 50% Fibonacci retracement level of the downward move from the $2,198 high to $1,936 low. Additionally, there was a break above a key downtrend line with resistance at $2,060 on the ETH/USD hourly chart.
Ethereum price is now trading above $2,020 and the 100 hourly simple moving average. If bulls remain in action above $2,020, the price could attempt a further rise. Immediate resistance is seen near the $2,120 level.
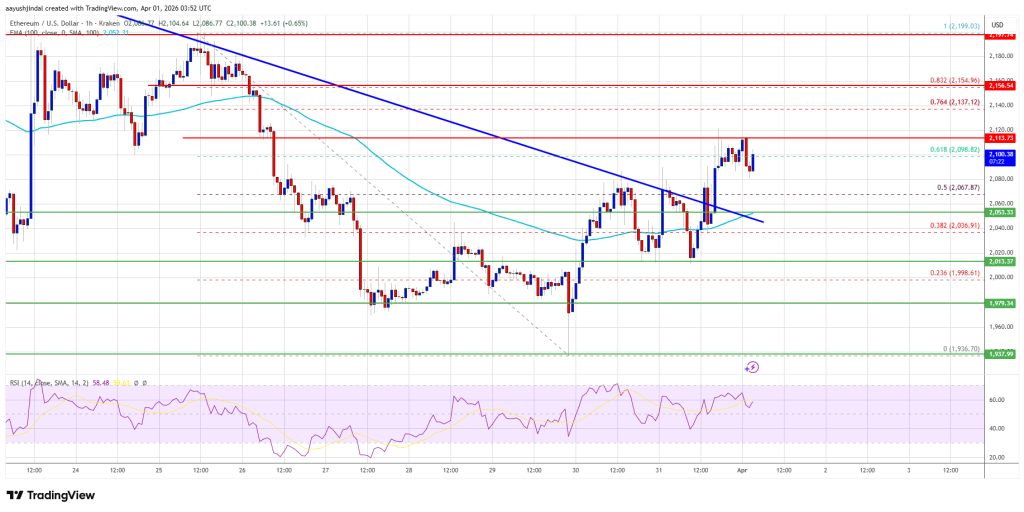
The first key resistance is near the $2,150 level or the 76.4% Fibonacci retracement level of the downward move from the $2,198 high to $1,936 low. The next major resistance is near the $2,200 level. A sharp move above the $2,200 resistance could push the price towards the $2,250 resistance. A bullish break above the $2,250 region could lead to further gains in the coming days. In the presented case, Ether could reach the resistance zone of $2,320 or even $2,350 in the short term.
Another drop in ETH?
If Ethereum fails to clear the $2,120 resistance, it could begin a further decline. Initial support on the downside is near the $2,050 level. The first major support lies near the $2,020 area.
A sharp move below the $2,020 support could push the price towards the $1,980 support. Any further losses could push the price towards the $1,950 region. The main support could be $1,880.
Technical indicators
Hourly MACD – The MACD for ETH/USD is gaining momentum in the bullish zone.
Hourly RSI – The RSI for ETH/USD is now above the 50 zone.
Major Support Level – $2,050
Major Resistance Level – $2,150