




Close Menu
Altcoin ObserverAltcoin Observer
  • Regulation
  • Bitcoin
  • Altcoins
  • Market
  • Analysis
  • DeFi
  • Security
  • Ethereum
Categories
  • Altcoins (3,732)
  • Analysis (3,840)
  • Bitcoin (4,470)
  • Blockchain (2,157)
  • DeFi (2,623)
  • Ethereum (2,773)
  • Event (119)
  • Exclusive Deep Dive (1)
  • Landscape Ads (2)
  • Market (2,714)
  • Press Releases (12)
  • Reddit (2,847)
  • Regulation (2,474)
  • Security (4,103)
  • Thought Leadership (3)
  • Videos (44)
Hand picked
  • Uniswap RFC explores running private exchanges using v4 and UniswapX hooks
  • Australia targets Telegram a day after Russia indicts Durov
  • Bitcoin’s weak hands fold
  • Success Story: Jonathan Nichols’ Learning Journey with 101 Blockchains
  • Kraken Cyprus honored at the 14th Invest Cyprus International Investment Awards
We are social
  • Facebook
  • Twitter
  • Instagram
  • YouTube
Facebook X (Twitter) Instagram
  • About us
  • Disclaimer
  • Terms of service
  • Privacy policy
  • Contact us
Facebook X (Twitter) Instagram YouTube LinkedIn
Altcoin ObserverAltcoin Observer
  • Regulation
  • Bitcoin
  • Altcoins
  • Market
  • Analysis
  • DeFi
  • Security
  • Ethereum
Events
Altcoin ObserverAltcoin Observer
Home»Ethereum»Ethereum Looks Bottom Compared to Bitcoin: What the Charts Say
Ethereum

Ethereum Looks Bottom Compared to Bitcoin: What the Charts Say

April 3, 2026No Comments
Share Facebook Twitter Pinterest LinkedIn Tumblr Reddit Telegram Email
Share
Facebook Twitter LinkedIn Pinterest Email


Trusted Editorial content, reviewed by leading industry experts and seasoned editors. Advertising disclosure

Ethereum passed the the best part of the last few months lose ground against Bitcoin, and this underperformance could we are now approaching a turning point, at least according to a new technical perspective shared by crypto analyst CrediBULL Crypto. Technical analysis shows that the ETH/BTC pair is no longer collapsing and is now quietly settling at a level that has historically led to an exhaustion of sales in the pair.

ETH/BTC holds range lows as selling pressure fades

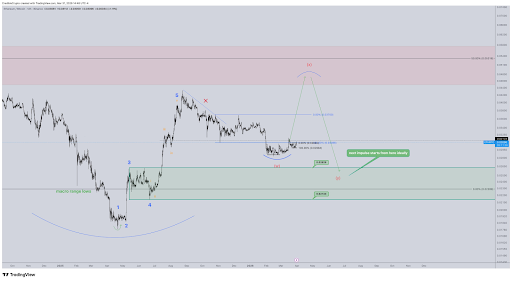
The ETH/BTC 12-hour chart tells a story that has been running since July 2025 and is now nearing completion. The ETH/BTC chart shows a pair that spent the last few months falling before finally reaching a support zone. As shown in the chart below, the ETH/BTC ratio has seen a sustained decline over the past few years since a peak near 0.0420 in mid-2025, which the analyst characterizes as wave 5 of a five-wave completed impulse.

The ratio cycled through a series of ups and downs throughout the second half of 2025 and January 2026. However, it was compressed between February and March into what looks like a macro support zone between around 0.02143 and 0.02626.

This support was noted by CrediBULL Crypto as important in this context, with the analyst confidently pointing out that the ETH/BTC pair this is the bottom here and is in a final phase preceding a real escape of the current range.
Ethereum Price 1

Ethereum/Bitcoin chart. Source: @CredibleCrypto on X

Recovering reach could lead to 20% outperformance

The Elliott Wave labeling on the chart frames the current structure of the ETH/BTC pair as a (w)-(x)-(y) correction after the previous five-wave impulse that peaked in mid-2025. The wave (w) has played out in its entirety and the projection is a wave (x) movement which should see the price of Ethereum increase by 20% compared to the price of Bitcoin.

The most important step in this planned move is to reclaim the previous lows around 0.0308-0.031, which are now turned into resistance. The inability to regain the level would probably be delay this scenariobut the current price development has been characterized by repeated attempts to push higher.

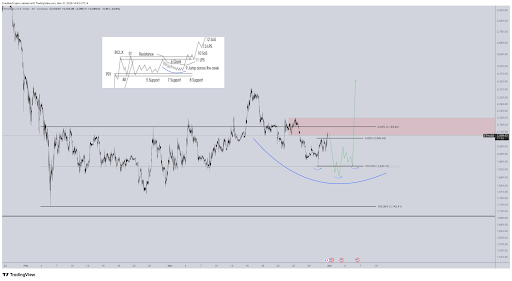
Moving to the ETH/USD 30-minute chart, the analyst overlays a Wyckoff accumulation pattern onto the current price action. The Ethereum/USD chart complements the ETH/BTC outlook, showing prices trading in a range just above $2,000. This is above a notable support level around the $1,900-$1,950 range, where multiple reactions have occurred.
Ethereum 2 Price

Ethereum Price Chart. Source: @CredibleCrypto

There is also a pink resistance zone above, which lies between around $2,120 and $2,200. CrediBULL Crypto’s projection, shown by the green arrows, envisions a brief retest of support below $1,900 before an upward resolution that pushes ETH price above the pink resistance zone at $2,400 and possibly higher.

Ethereum Price Chart from Tradingview.com
ETH bears continue to fall | Source: ETHUSDT on Tradingview.com

Featured image created with Dall.E, chart from Tradingview.com

Editorial process as Bitcoinist focuses on providing thoroughly researched, accurate and unbiased content. We follow strict sourcing standards and every page undergoes careful review by our team of top technology experts and seasoned editors. This process ensures the integrity, relevance and value of our content to our readers.


Source link

Share. Facebook Twitter Pinterest LinkedIn Tumblr Email
Previous ArticleBitcoin bullish bets hit a 28-month high on Bitfinex, and that’s music to bears’ ears
Next Article CryptoMondays Launches “Growth Engine” Partner Program to Scale Web3 Brands Through the World’s Largest IRL Crypto Community

Related Posts

Ethereum

Ethereum Foundation Board Update | Ethereum Foundation Blog

July 30, 2026
Ethereum

Morgan Stanley uses $7.4 trillion in client assets and minimal fees to hijack Wall Street’s crypto boom

July 29, 2026
Ethereum

On-chain data shows 5,280 ETH flowing to single address following quiet Triple-A wallet breach

July 27, 2026
Add A Comment
Leave A Reply Cancel Reply

Single Page Post
Share
  • Facebook
  • Twitter
  • Instagram
  • YouTube
Featured Content
Event

Dutch Blockchain Week 2026 strengthens position as Europe’s leading B2B blockchain event week

April 14, 2026

Amsterdam, April 2026 – Dutch Blockchain Week 2026 is rapidly evolving into one of Europe’s…

Event

Global Games Show Riyadh: The Ultimate Creator & Influencer Hub

March 31, 2026

The fast-evolving gaming ecosystem of Riyadh is powered by solid national investment, a flourishing esports…

1 2 3 … 82 Next
  • Facebook
  • Twitter
  • Instagram
  • YouTube

Australia targets Telegram a day after Russia indicts Durov

July 30, 2026

Ethena whales withdraw 102 million tokens from exchanges: has ENA selling pressure eased?

July 30, 2026

Audiera loses KEY support – can BEAT recover from 24% crash?

July 29, 2026
Facebook X (Twitter) Instagram LinkedIn
  • About us
  • Disclaimer
  • Terms of service
  • Privacy policy
  • Contact us
© 2026 Altcoin Observer. all rights reserved by Tech Team.

Type above and press Enter to search. Press Esc to cancel.

bitcoin
Bitcoin (BTC) $ 75,817.00
ethereum
Ethereum (ETH) $ 2,232.11
tether
Tether (USDT) $ 0.998912
bnb
BNB (BNB) $ 692.83
xrp
XRP (XRP) $ 1.18
usd-coin
USDC (USDC) $ 0.999486
solana
Solana (SOL) $ 90.27
tron
TRON (TRX) $ 0.318399
staked-ether
Lido Staked Ether (STETH) $ 2,265.05
figure-heloc
Figure Heloc (FIGR_HELOC) $ 1.03