


In today’s Bitcoin ETF news, BTC fell to $79,800 on Thursday, falling below the psychologically critical $80,000 threshold, even as Bitcoin ETF’s weekly spot inflows exceeded $1 billion for the first time since January. The price is approximately -3.6% off its recent high of $82,800, with 24-hour trading volume remaining high as traders scramble to interpret the signal.
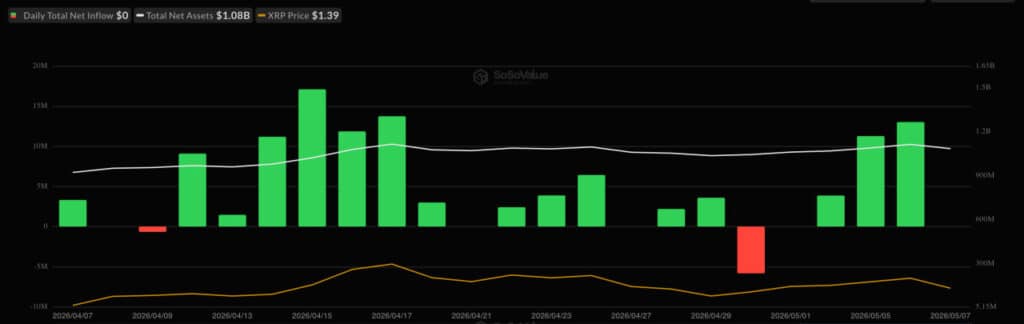
SoSoValue’s headline number is hard to ignore: $1.05 billion in net weekly ETF inflows, the largest weekly inflow in nearly four months. These are institutions that buy aggressively.
Yet the BTC price drop still happened. This apparent contradiction is exactly what this article reveals.
DISCOVER: 15+ upcoming announcements to watch out for in 2025
Bitcoin ETF News: Why Institutions Can Buy $1 Billion and the Price Continues to Fall
Here’s the simplified version of what seems like a paradox: institutional buyers and retail sellers can both be active at the same time, and in the short term, it is the sellers who set the price. Think of it like a busy fish market.
A major restaurant chain placed a huge order for salmon, but currently at the dockside auction, nervous fishermen are selling their catch cheaply because they need cash today. The restaurant order is real and will be paid, but that doesn’t stop the morning panic price from looking ugly.
Spot Bitcoin ETF products like BlackRock’s IBIT don’t buy Bitcoin in a dramatic market order like most news reports say, but they still drive the price skyward. They use volume-weighted strategies, gradually accumulating over trading sessions.
Meanwhile, short-term traders and leveraged futures positions are liquidated when the price falls below round numbers like $80,000 – and these forced sales instantly hit the market, creating the drop you see on the chart.
Swissblock data reinforces this structural picture. The Bitcoin Risk Index reset to near zero, while net ETF flows turned positive at around 3,000 BTC. Historically, this low-risk reset has coincided with further accumulation near major support clusters, not a new breakout.
The trend of institutional cryptocurrency holders absorbing Bitcoin ETF positions during periods of price weakness is not new, but the scale of $80,000 is notable.
Bitcoin’s market dominance has also climbed above 61%, suggesting that capital flowing out of altcoins is finding its way into BTC rather than leaving crypto altogether. This is a situation structurally different from that of a general market liquidation.
EXPLORE: How BlackRock’s IBIT works as an institutional permissions structure – and why it changes accumulation dynamics during dips
Should you buy Bitcoin Dip at $80,000?
The honest answer is this: It depends on what price level you are comfortable defending and whether you understand that institutional floors are real but not guaranteed. The current technical picture gives you hard numbers to work with, not vague optimism.
Crypto trader Jelle identified $78,000 as the first major support zone, where the 200-day moving average and exponential moving average cluster converge. According to Jelle, “a retest of the 200-day moving average could allow Bitcoin to retest higher price targets,” meaning that a decline to this zone, while uncomfortable, would not break the long-term structure. The weekly open at $78,500 is the key near-term level that bulls are currently defending.
200-day MA/EMA cluster acting as resistance, as expected.
The first main area of interest is at $78,000.
Turn that into support and we can try MAs again.$BTC pic.twitter.com/LcqRI5tG1o
– Jelle (@CryptoJelleNL) May 7, 2026
If this level fails to hold, crypto trader Killa XBT points to a deeper support zone between $76,300 and $74,700. This is a significant decline from current levels – approximately -5 to -7% further decline ahead of the next major technical bottom. You need to know this number before deciding whether to buy the dip today or wait.
The institutional attempt is real, but it only holds as long as the net flows remain positive. Two consecutive sessions of significant ETF outflows near the $80,000 level would be a significant warning sign that the smart money accumulation thesis is softening.
Look at SoSoValue’s daily flow data as an early indicator. For more context on the psychological pressure retail investors face in times like these, this analysis on whether holding or selling makes sense during phases of institutional accumulation is worth reading before acting.
DISCOVER: 10+ next cryptos to 100X in 2025
Follow 99Bitcoins on X (Twitter) For the latest market updates and subscribe on YouTube for daily market analysis from experts.
The article Bitcoin ETF News: BTC Slips Below $80,000 Despite Record $1 Billion ETF Inflows: Time to Buy the Dip? appeared first on 99Bitcoins.