


SIREN achieved one of the strongest performances in the market after its price surged by 26.72% in the last 24 hours. The rally pushed the token to around $0.73 while its market cap expanded to $529.94 million.
Trading volume soared 258.53% to approximately $50.9 million, showing that new activity accompanied the price rise. This combination suggests that buyers have returned aggressively after a prolonged period of consolidation.
Previous rallies had struggled to attract sustained participation. However, the latest move generated significantly higher turnover, indicating stronger conviction among traders.
Therefore, SIREN established himself as one of the session’s standout performers and shifted attention to his broader recovery structure.
SIREN traders pile in as leverage rises
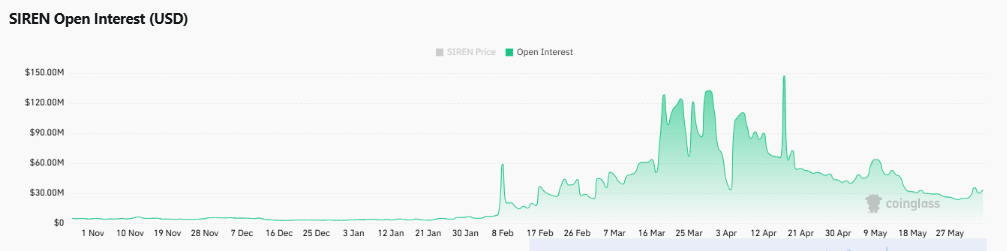
Speculative activity has also accelerated in derivatives markets. Open interest increased 53.19% to $48.76 million, reflecting a substantial increase in active positions.
Such growth indicates that traders have increased their exposure rather than simply rotating existing capital. The expansion occurred alongside rising prices, suggesting that market participants were anticipating further rise.
Historically, rapid growth in open interest rates amplified volatility because leveraged positions created greater liquidation risks. However, this increase also reflects growing confidence in the ongoing recovery.
Rather than showing hesitation, derivatives traders continued to increase their exposure as SIREN progressed. This behavior reinforced the bullish narrative, although it also increased the likelihood of sharp price swings in the event of an unexpected change in sentiment.
Can the bulls turn the rally into a reversal?
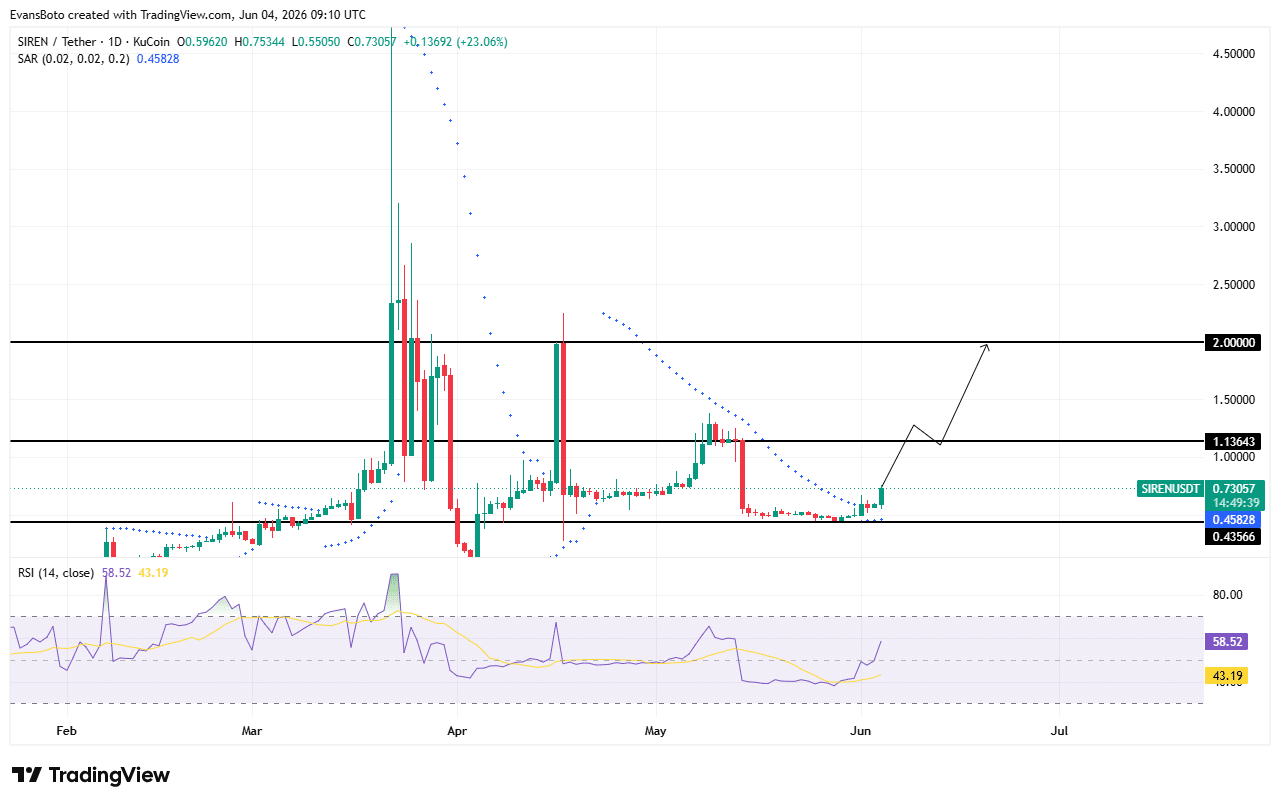
The price action painted a much broader recovery story than just a daily rally. SIREN had defended the major support zone between $0.435 and $0.458 after months of weakness.
Following this defense, buyers pushed the token towards $0.73 and established a lower structure.
The Parabolic SAR had already fallen below price, indicating that trending conditions had improved significantly from previous weeks. The RSI also climbed to 58.52 after spending much of May near depressed levels.
The recovery showed a strengthening of buying pressure without entering overbought territory. Meanwhile, the first major resistance remained at $1.136. A successful crossing of this barrier would strengthen the case for a prolonged recovery.
In this scenario, attention would likely shift to the broader resistance zone near $2.00.
Where will liquidity wait next?
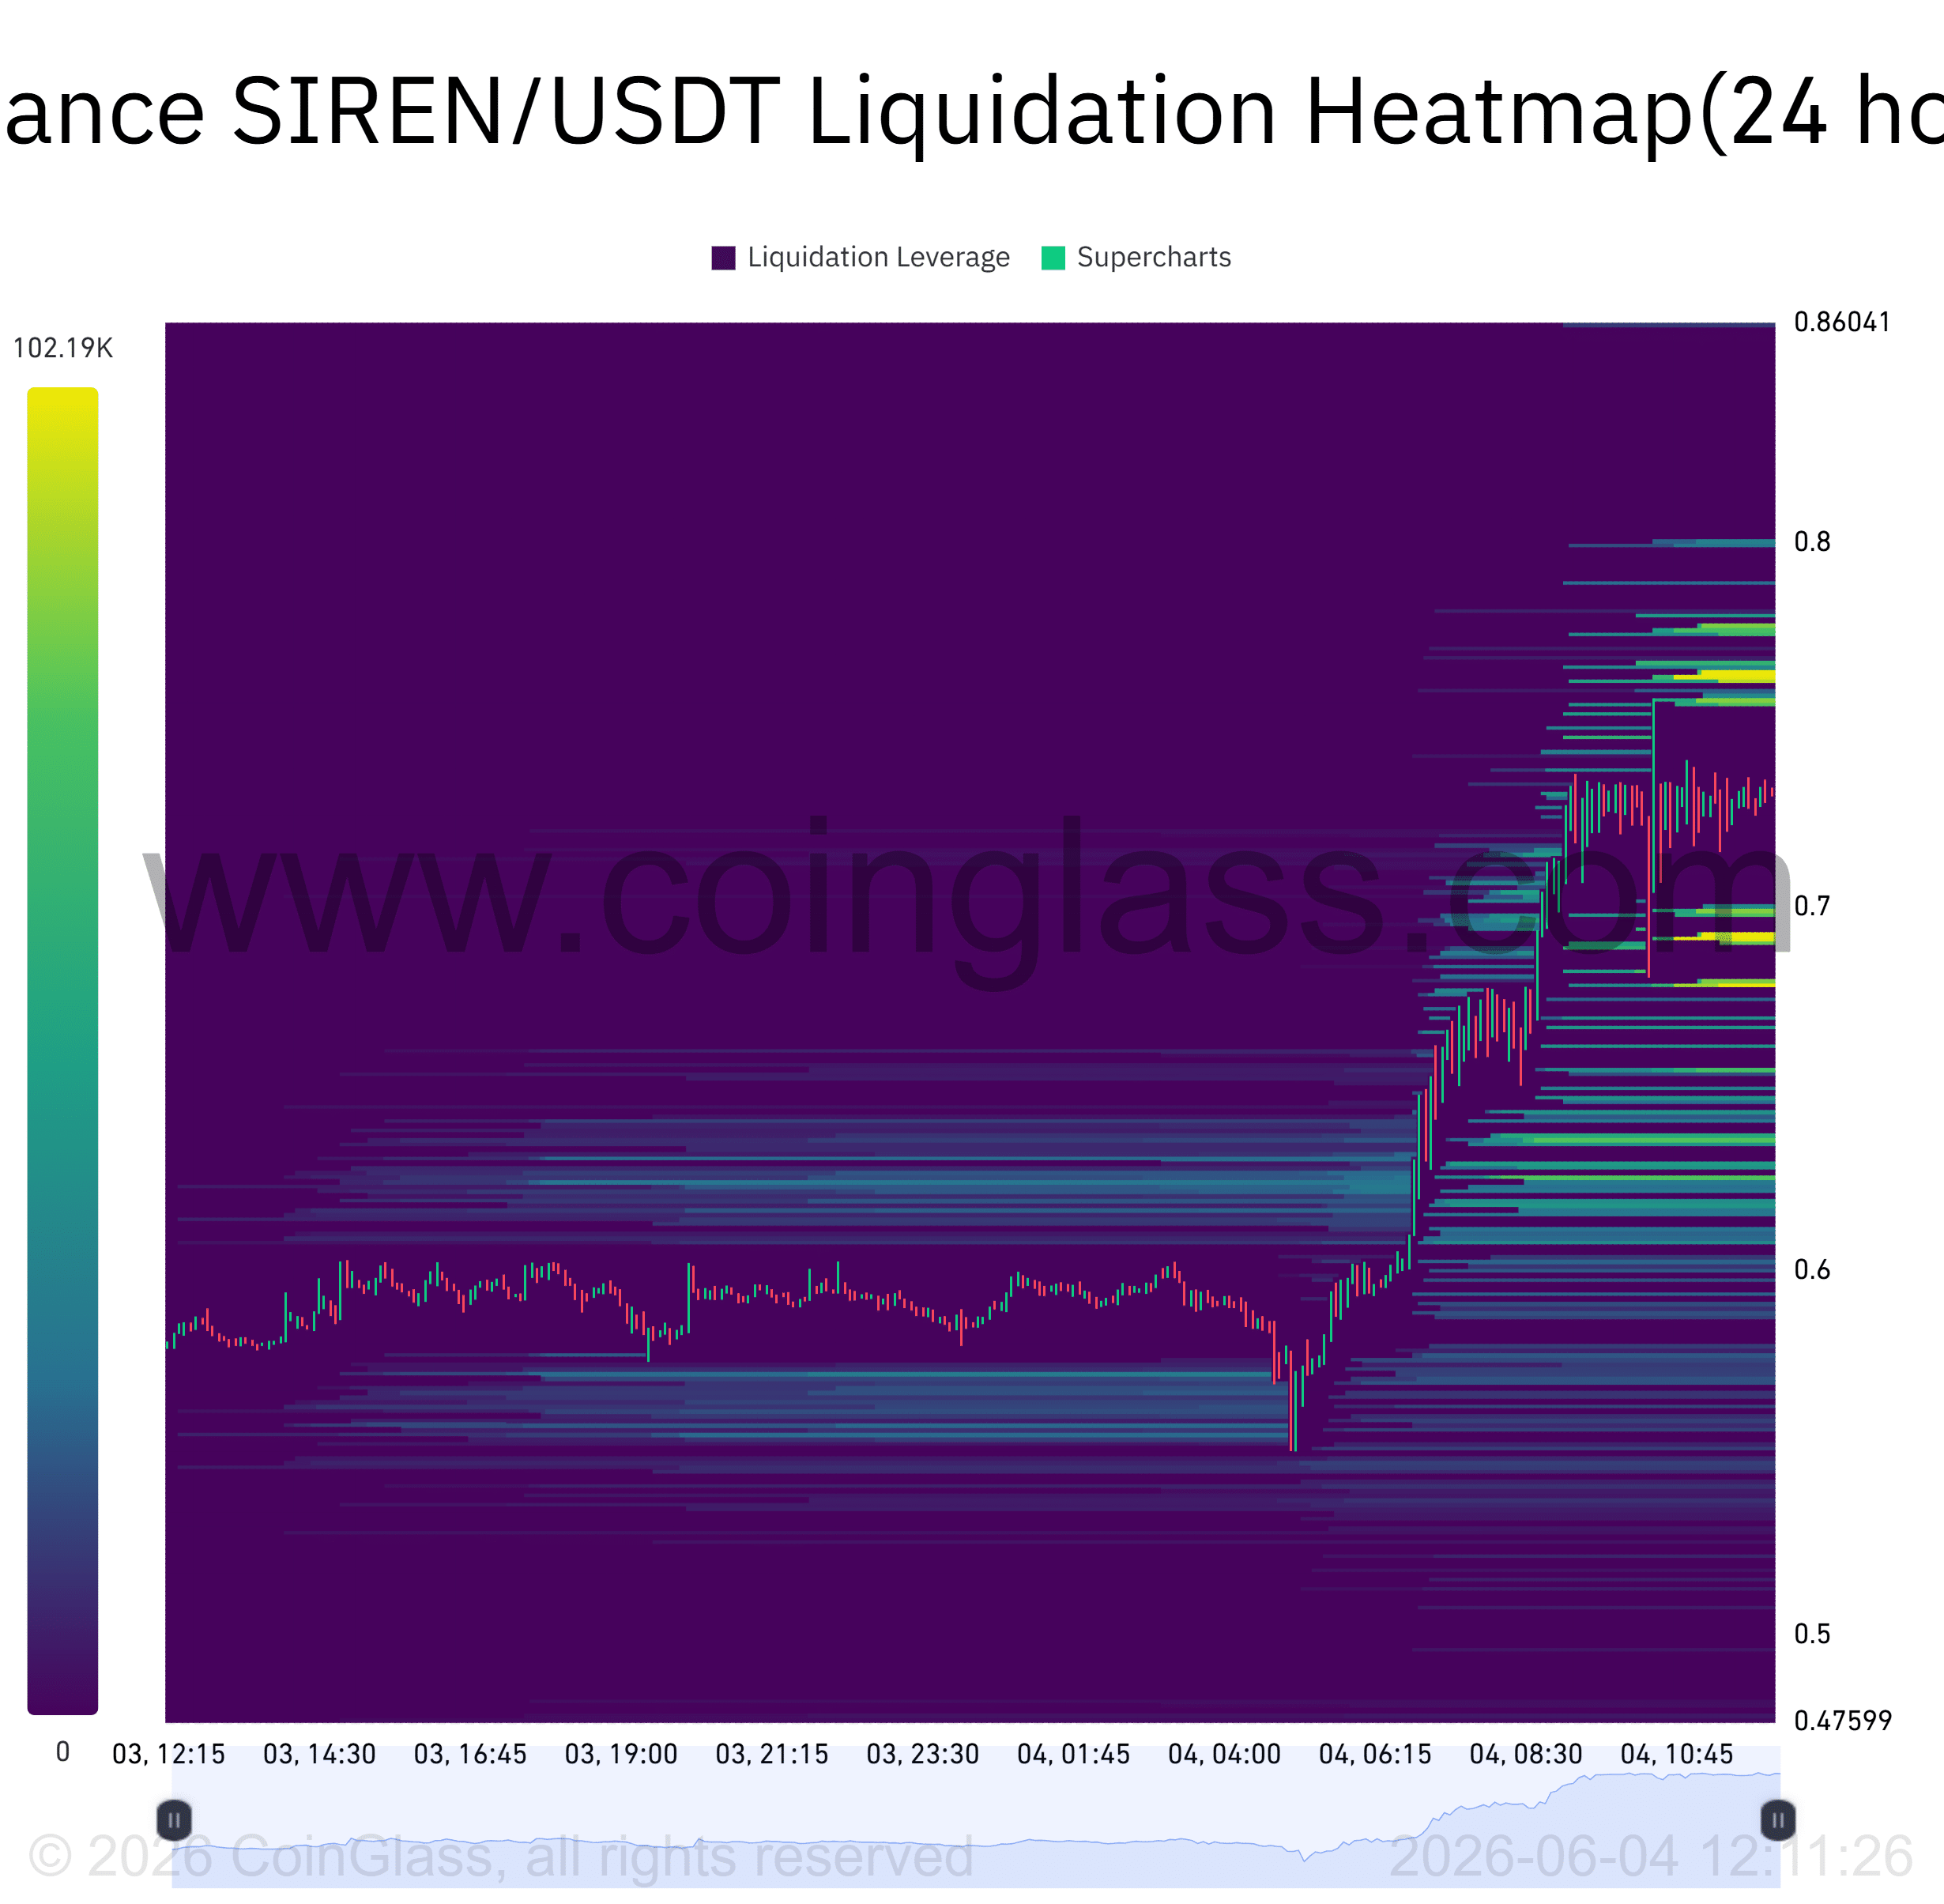
The selloff heat map highlighted several areas where volatility could intensify. Dense liquidity clusters have emerged around the $0.77 to $0.80 region, directly above the current market price.
These areas often attract price action because large concentrations of leveraged positions accumulate there. Therefore, SIREN appeared positioned to challenge nearby liquidity if buying pressure remained intact.
Additional clusters have also formed around the $0.69-$0.70 region, creating a near-term support zone below current levels. Market participants have frequently targeted these pockets during periods of intense activity.
Therefore, traders would likely watch these areas closely for possible squeezes. The concentration of liquidity above the price slightly favored continued upside exploration in the short term.
Final summary
- SIREN attracted new buying interest as volume and participation increased sharply.
- Rising open interest and a stronger structure supported a potential continuation of the rally.