




AAVE recorded one of its steepest daily declines in recent weeks, falling 12% in the last 24 hours to trade near $61.12. The correction erased much of its recent gains and pushed the asset deeper into its broader downtrend.
Trading activity grew aggressively during the sale, with volume climbing 75.62% to $474.4 million. Such an increase suggests that market participants remained very active despite the decline.
Rather than signaling a lack of interest, rising volumes indicated that sellers stepped up their activity while buyers tried to absorb some of the pressure. However, increased participation has failed to stabilize price developments.
Buyers continue to fall into weakness
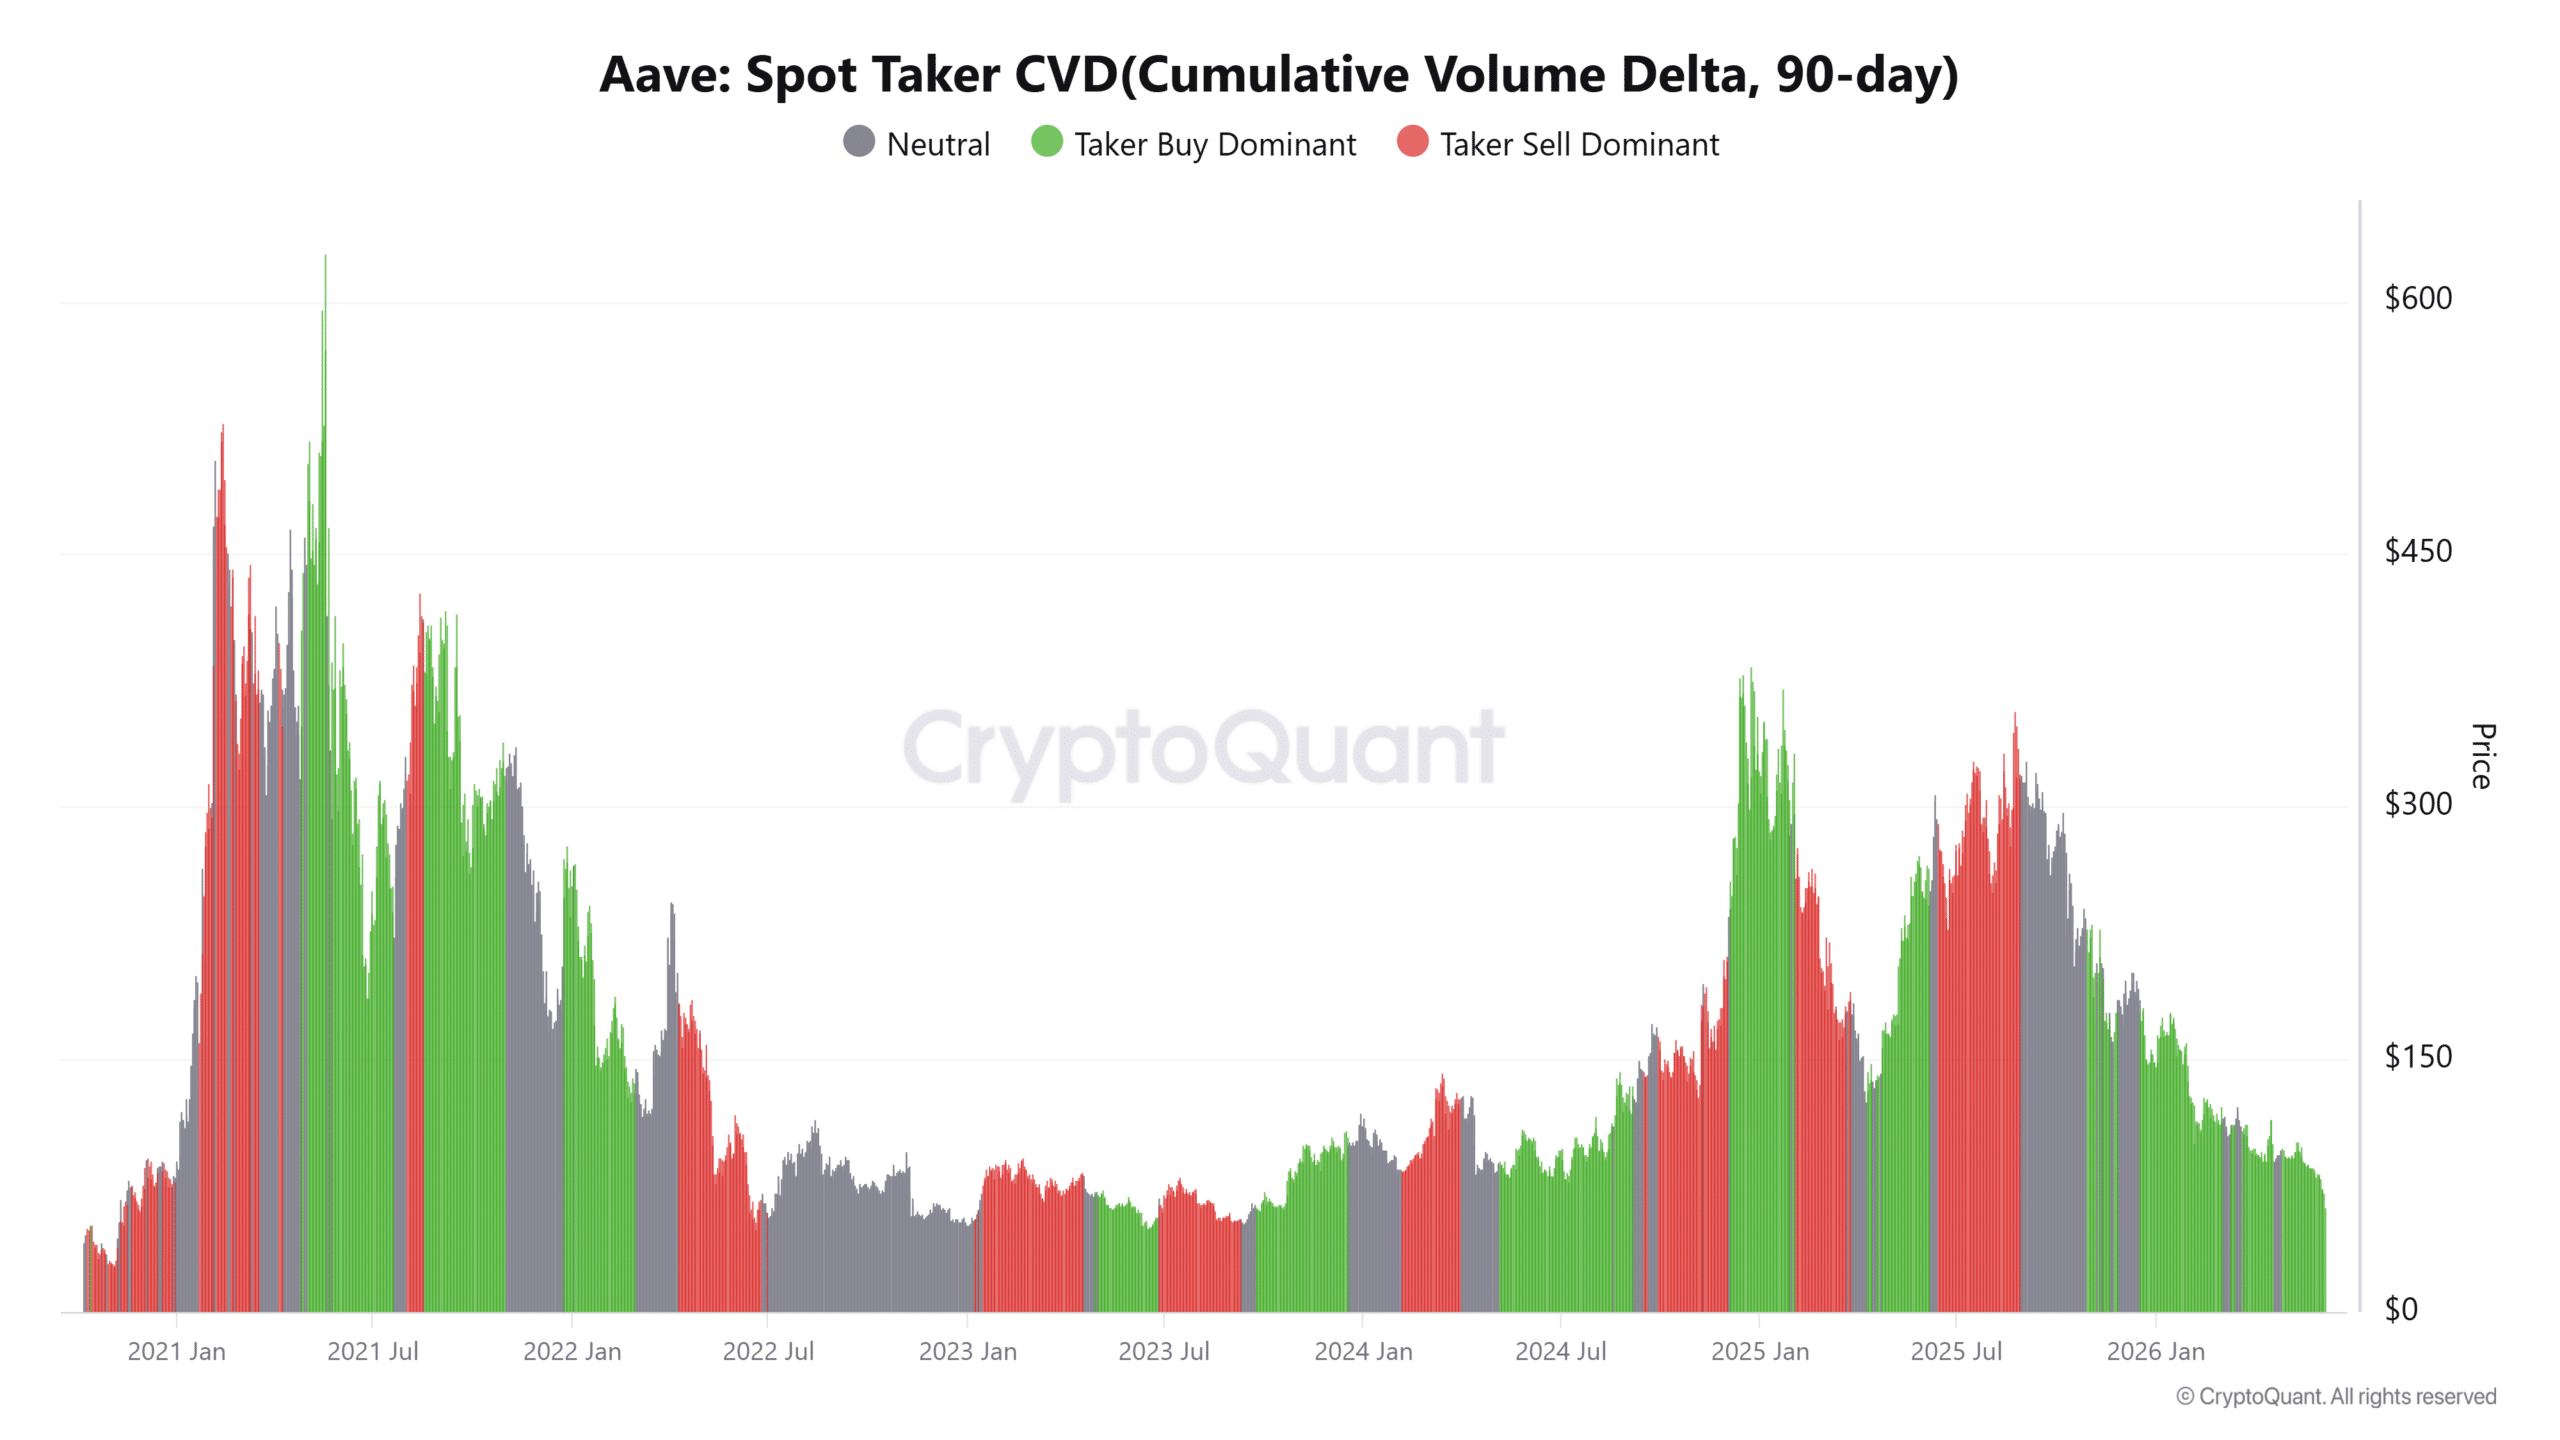
Despite the strong correction, the CVD of the spot taker remained dominant among buyers throughout the period. Such behavior suggests that some participants viewed the decline as an opportunity rather than a reason to withdraw.
However, prices continued to fall, indicating that pressure on the sales side remained stronger than demand entering the market.
The divergence between dominant buyer and taker activity and falling prices highlighted a market in which buyers attempted to absorb supply but struggled to regain control.
Has AAVE lost its final support?
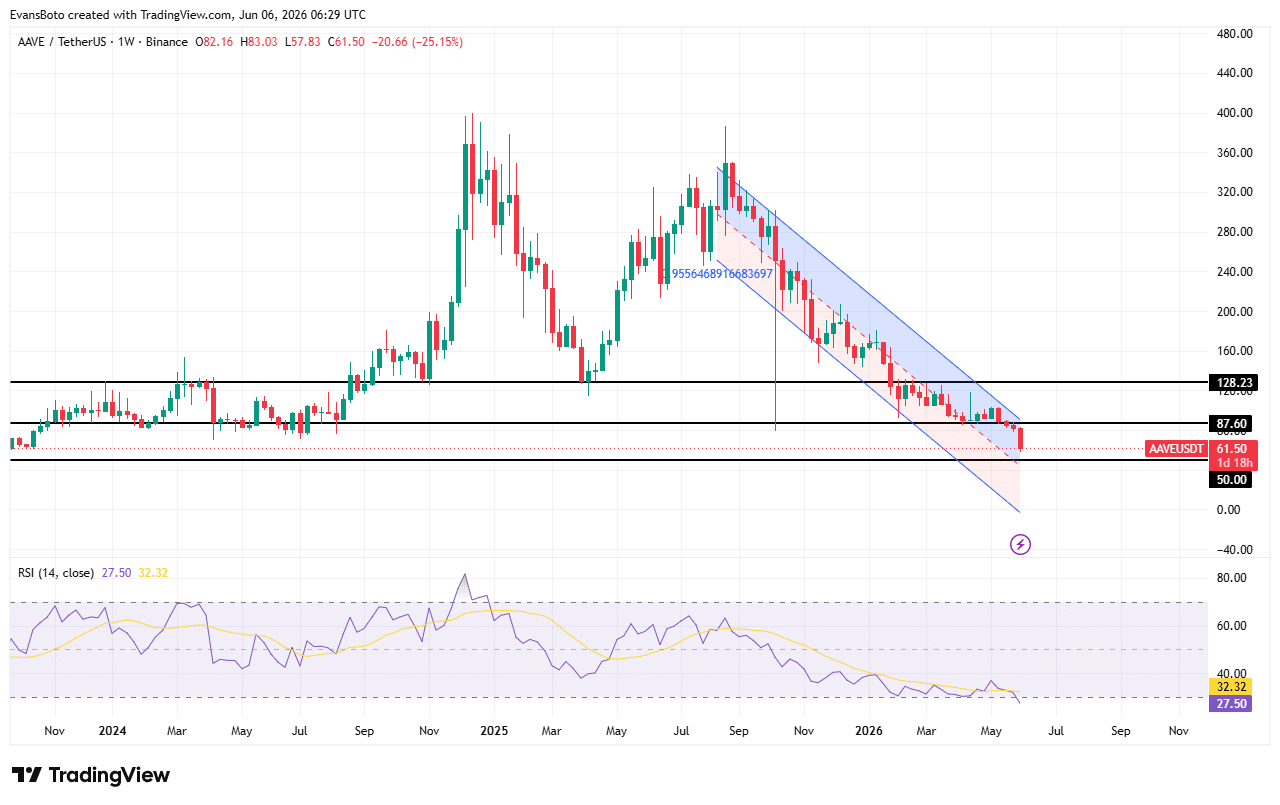
The weekly chart shows AAVE extending its decline below the critical support level of $87.60 after spending months in a descending channel.The price also remained well below the main resistance area near $128.23, reinforcing the broader bearish structure.
Repeated lower highs and lower lows continued to define market direction, while the break below support opened the way to the next significant level near $50. Meanwhile, the RSI fell to 27.50 after falling below its signal line at 32.32.
This reading places the indicator firmly in oversold territory and reflects continued selling pressure in the market.
If buyers defend the current zone, AAVE could attempt a rebound. Otherwise, continued weakness would make the $50 support increasingly vulnerable.
Liquidity Clusters Point Up
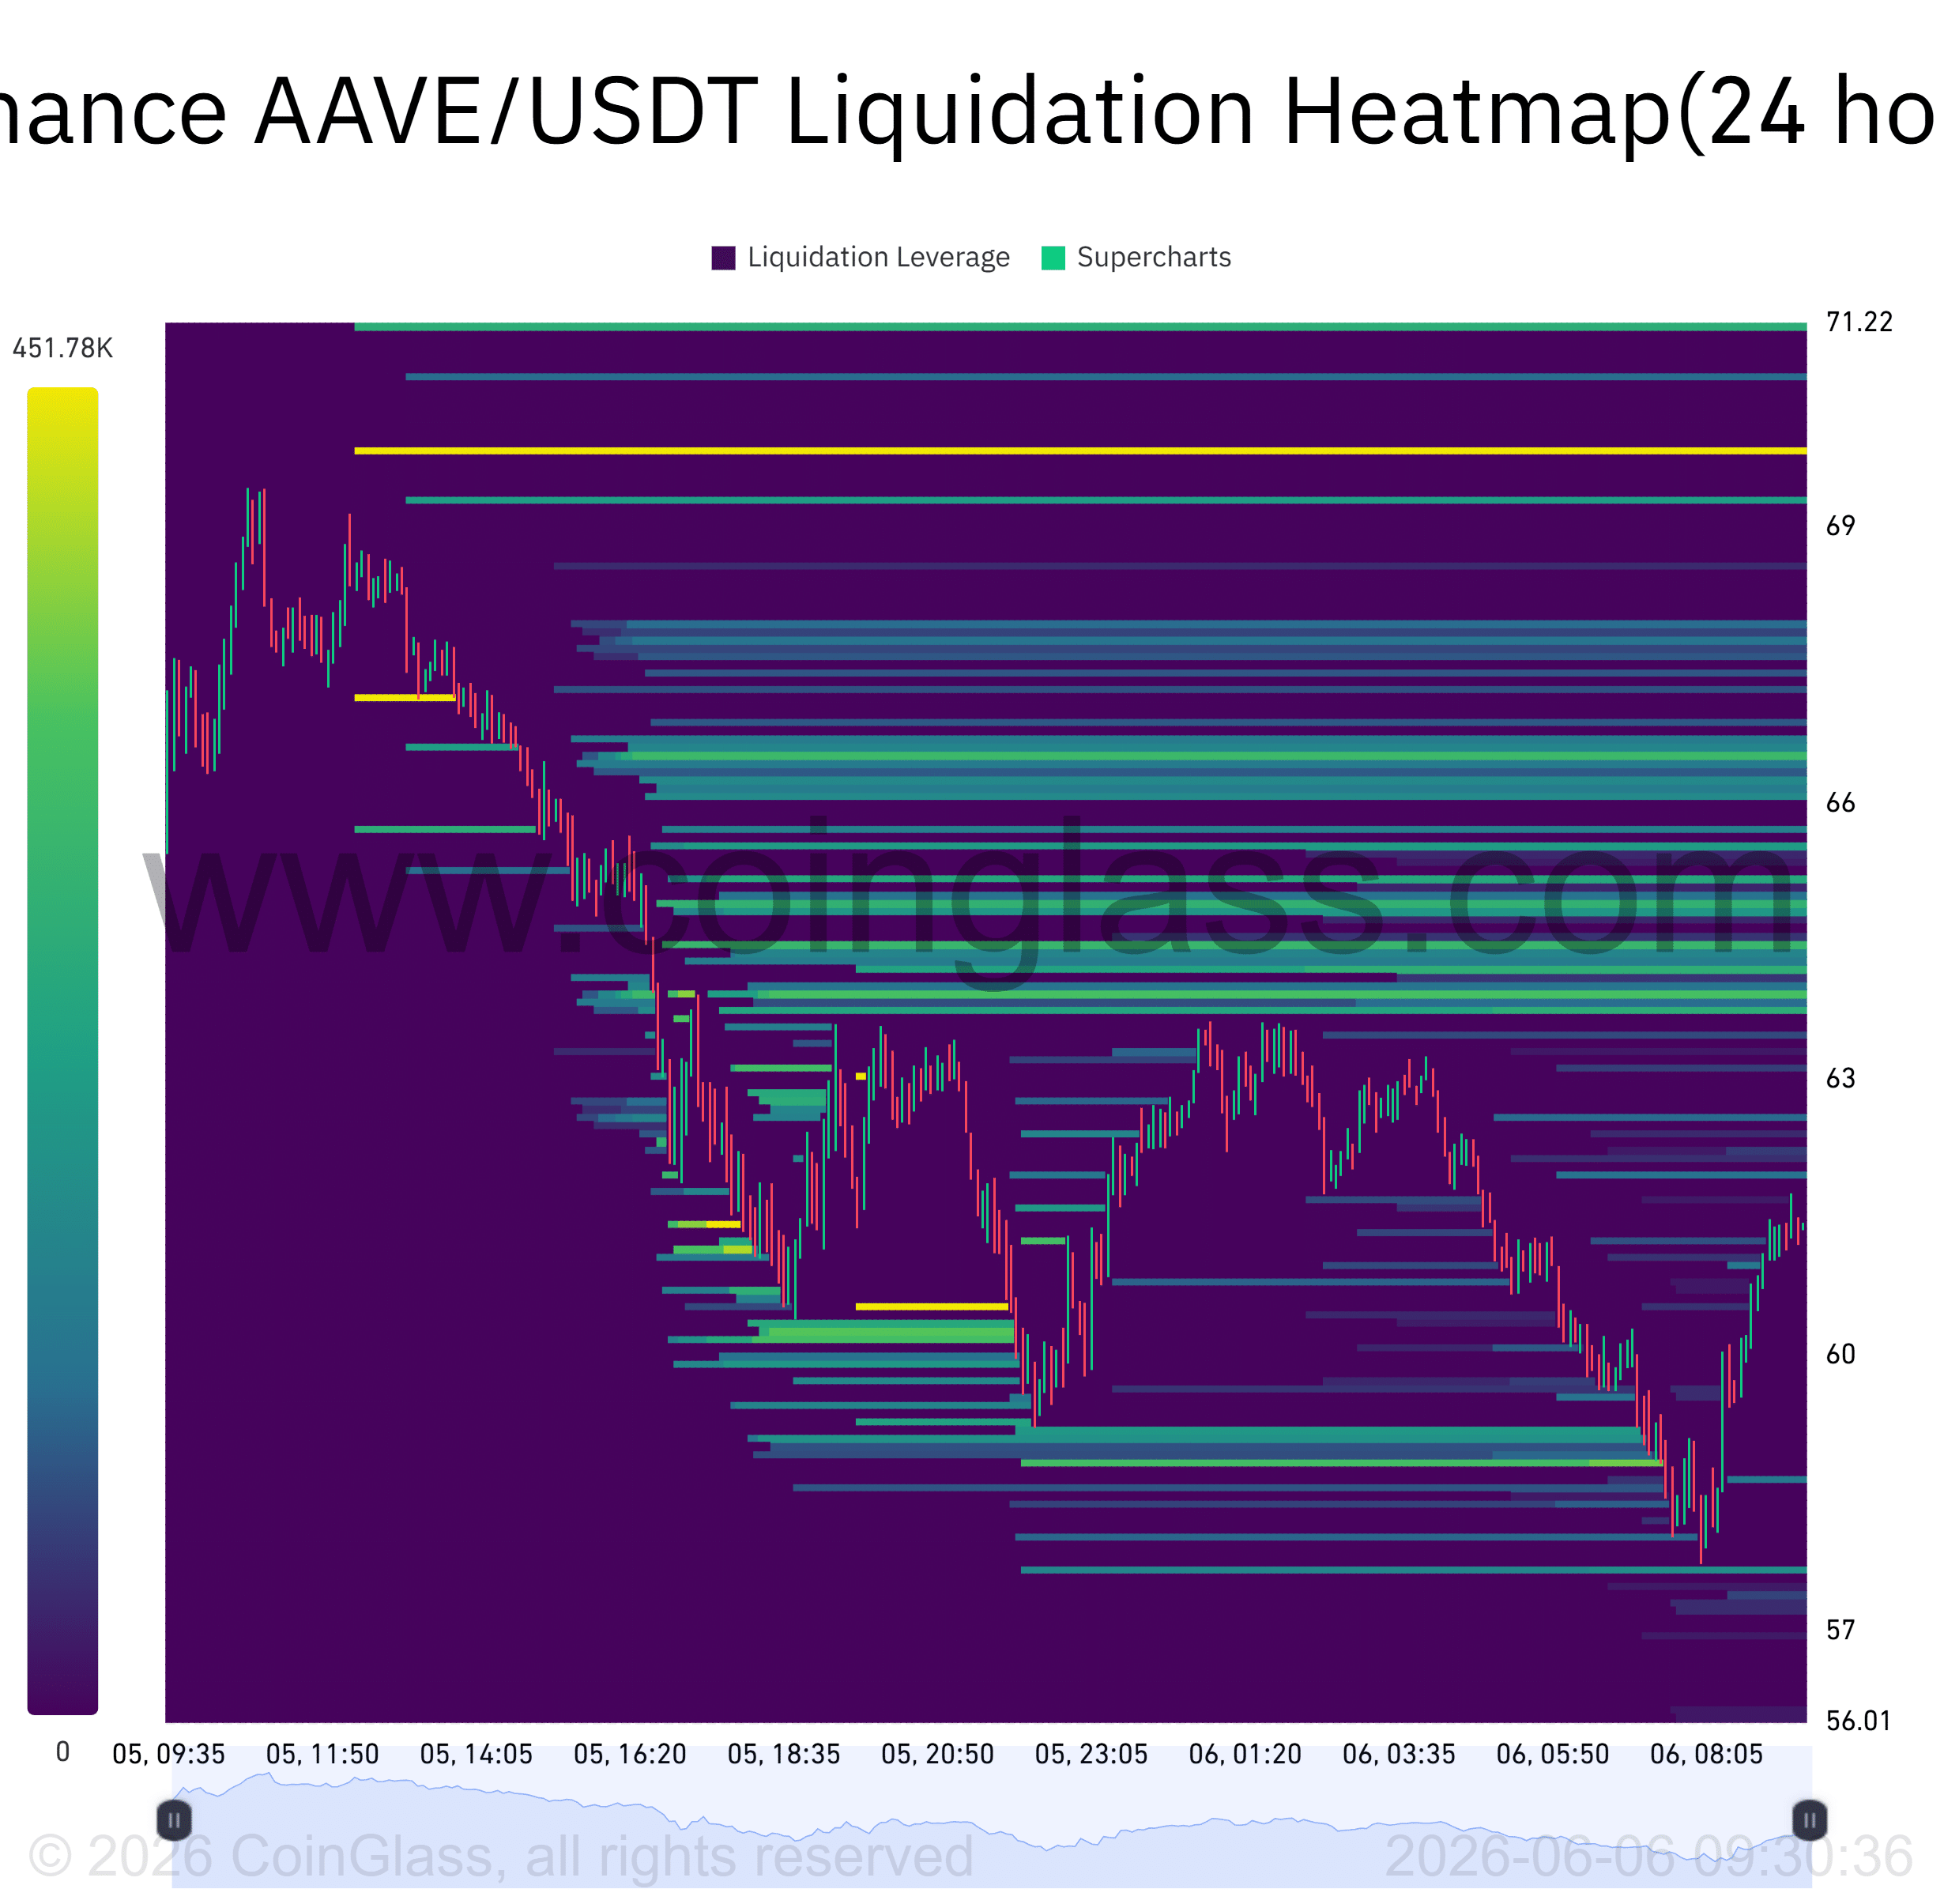
The liquidation heat map revealed that the greatest concentrations of leverage were above the current market price.
Several notable liquidity clusters appeared between $64 and $66, while another significant concentration appeared around the $69 to $70 region.
Recent trading activity has already shown that AAVE is attempting to recover from intraday lows, adding relevance to these overhead targets.
If buyers maintain their presence, the asset could wipe out these pockets of liquidity before establishing its next direction.
On the other hand, failure to sustain the bounce would keep the bearish pressure intact and limit the likelihood of reaching these higher liquidation zones.
Final Summary
- AAVE lost key support as buyers continued to absorb heavy selling pressure.
- The oversold RSI and general liquidity could support a near-term recovery.


