


Ethena (ENA) attracted new attention after gaining 4.34% to trade at $0.0941. Trading volume also jumped 69.15% to $149 million.
The recovery coincided with a sharp increase in network activity. Daily active addresses climbed to 5,057, their highest level since November 2025.
The increase in participation suggests growing engagement across the Ethena ecosystem despite ENA’s prolonged decline from late 2025 highs.
Can ENA complete its bullish reversal pattern?
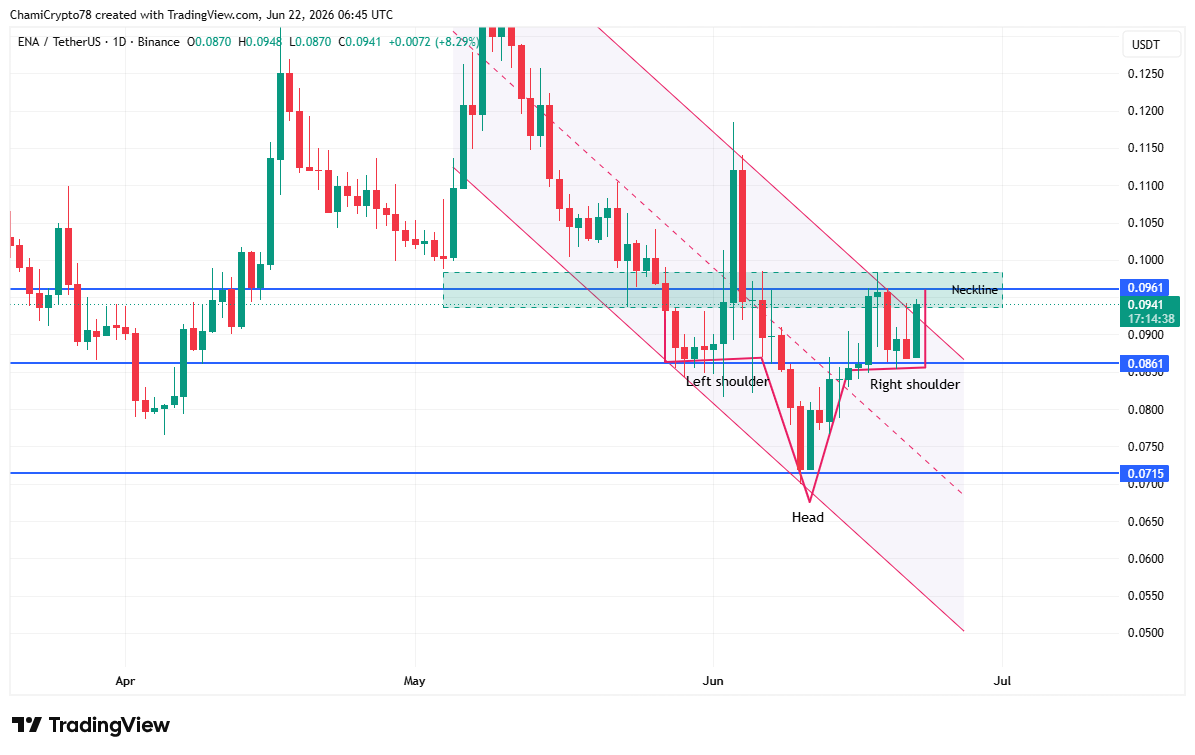
As for the Ethena price prediction, ENA formed an inverse head-and-shoulders pattern after finding support near $0.0715 and reaching higher lows around $0.086. At the same time, the token broke out of a descending channel that had capped price action since early May.
Buyers defended the right shoulder and pushed ENA back towards neckline resistance at $0.096. This recovery strengthened the bullish structure and put more emphasis on the current resistance zone.
Price also remained above right shoulder support despite multiple rejections near the neckline.
A break above $0.096 could pave the way to the psychological $0.10 level. This level could also shape the next phase of the Ethena price prediction, as traders look for confirmation of a broader trend reversal.
However, sellers continued to defend the area, leaving the pattern dependent on a decisive close above resistance.
Indicators reinforce bullish structure
Technical indicators are increasingly aligned with improving price structure.
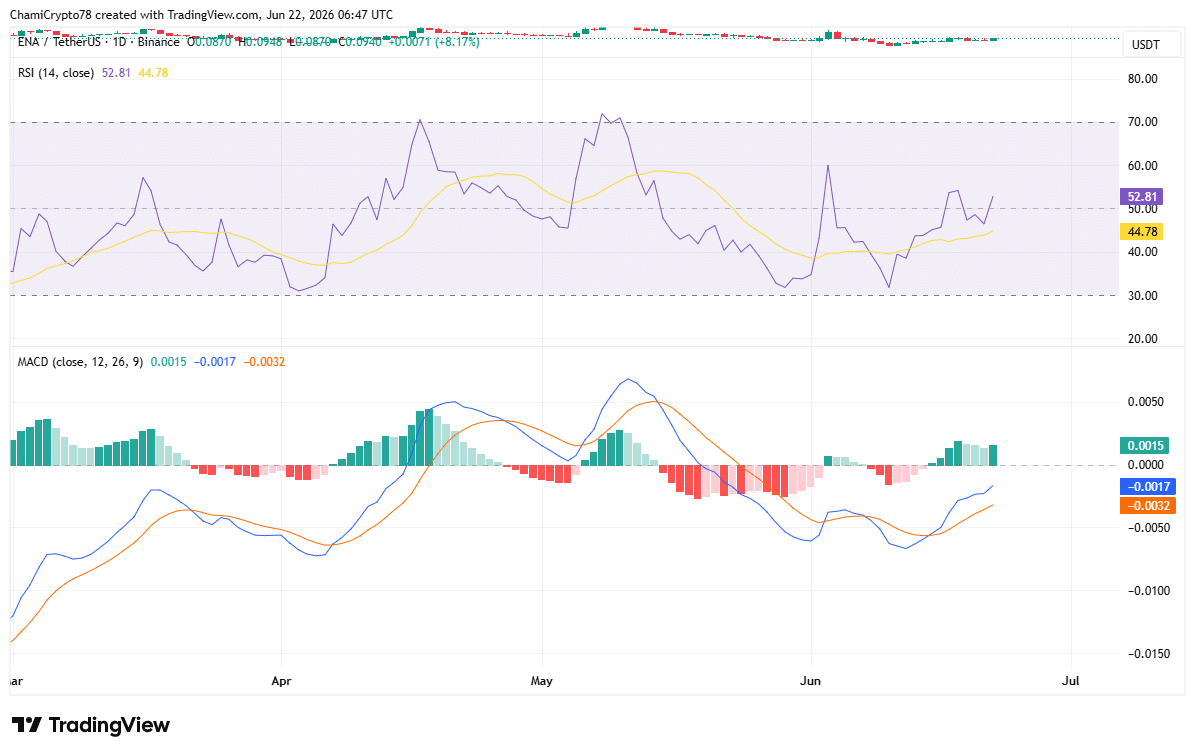
The Relative Strength Index (RSI) increased to 52.81 and surpassed its moving average at 44.78. This suggests that buying pressure has strengthened during the recent rally.
Rather than remaining below neutral territory, the RSI held above 50 and reflected improving momentum.
Meanwhile, the MACD displayed a bullish crossover. The MACD line rose to 0.0015 and remained above the signal line at -0.0017.
In addition to this, the histogram continued to print positive bars, indicating that the bullish momentum has strengthened over the past few sessions.
Neither indicator entered overbought territory. Despite this, both supported the idea of further upside if buyers break through the $0.096 neckline.
Where could liquidations lead next?
Liquidation data highlighted several areas where leveraged positions remained concentrated. The largest liquidity cluster was between $0.096 and $0.098, directly above the current price action.
This concentration suggested that an entry into the region could trigger short selloffs and amplify volatility.
As a result, traders continued to monitor the area closely as ENA approached resistance.
Below the market, additional pockets of liquidity appeared near $0.092 and $0.089. These levels could attract prices if sellers regain control.
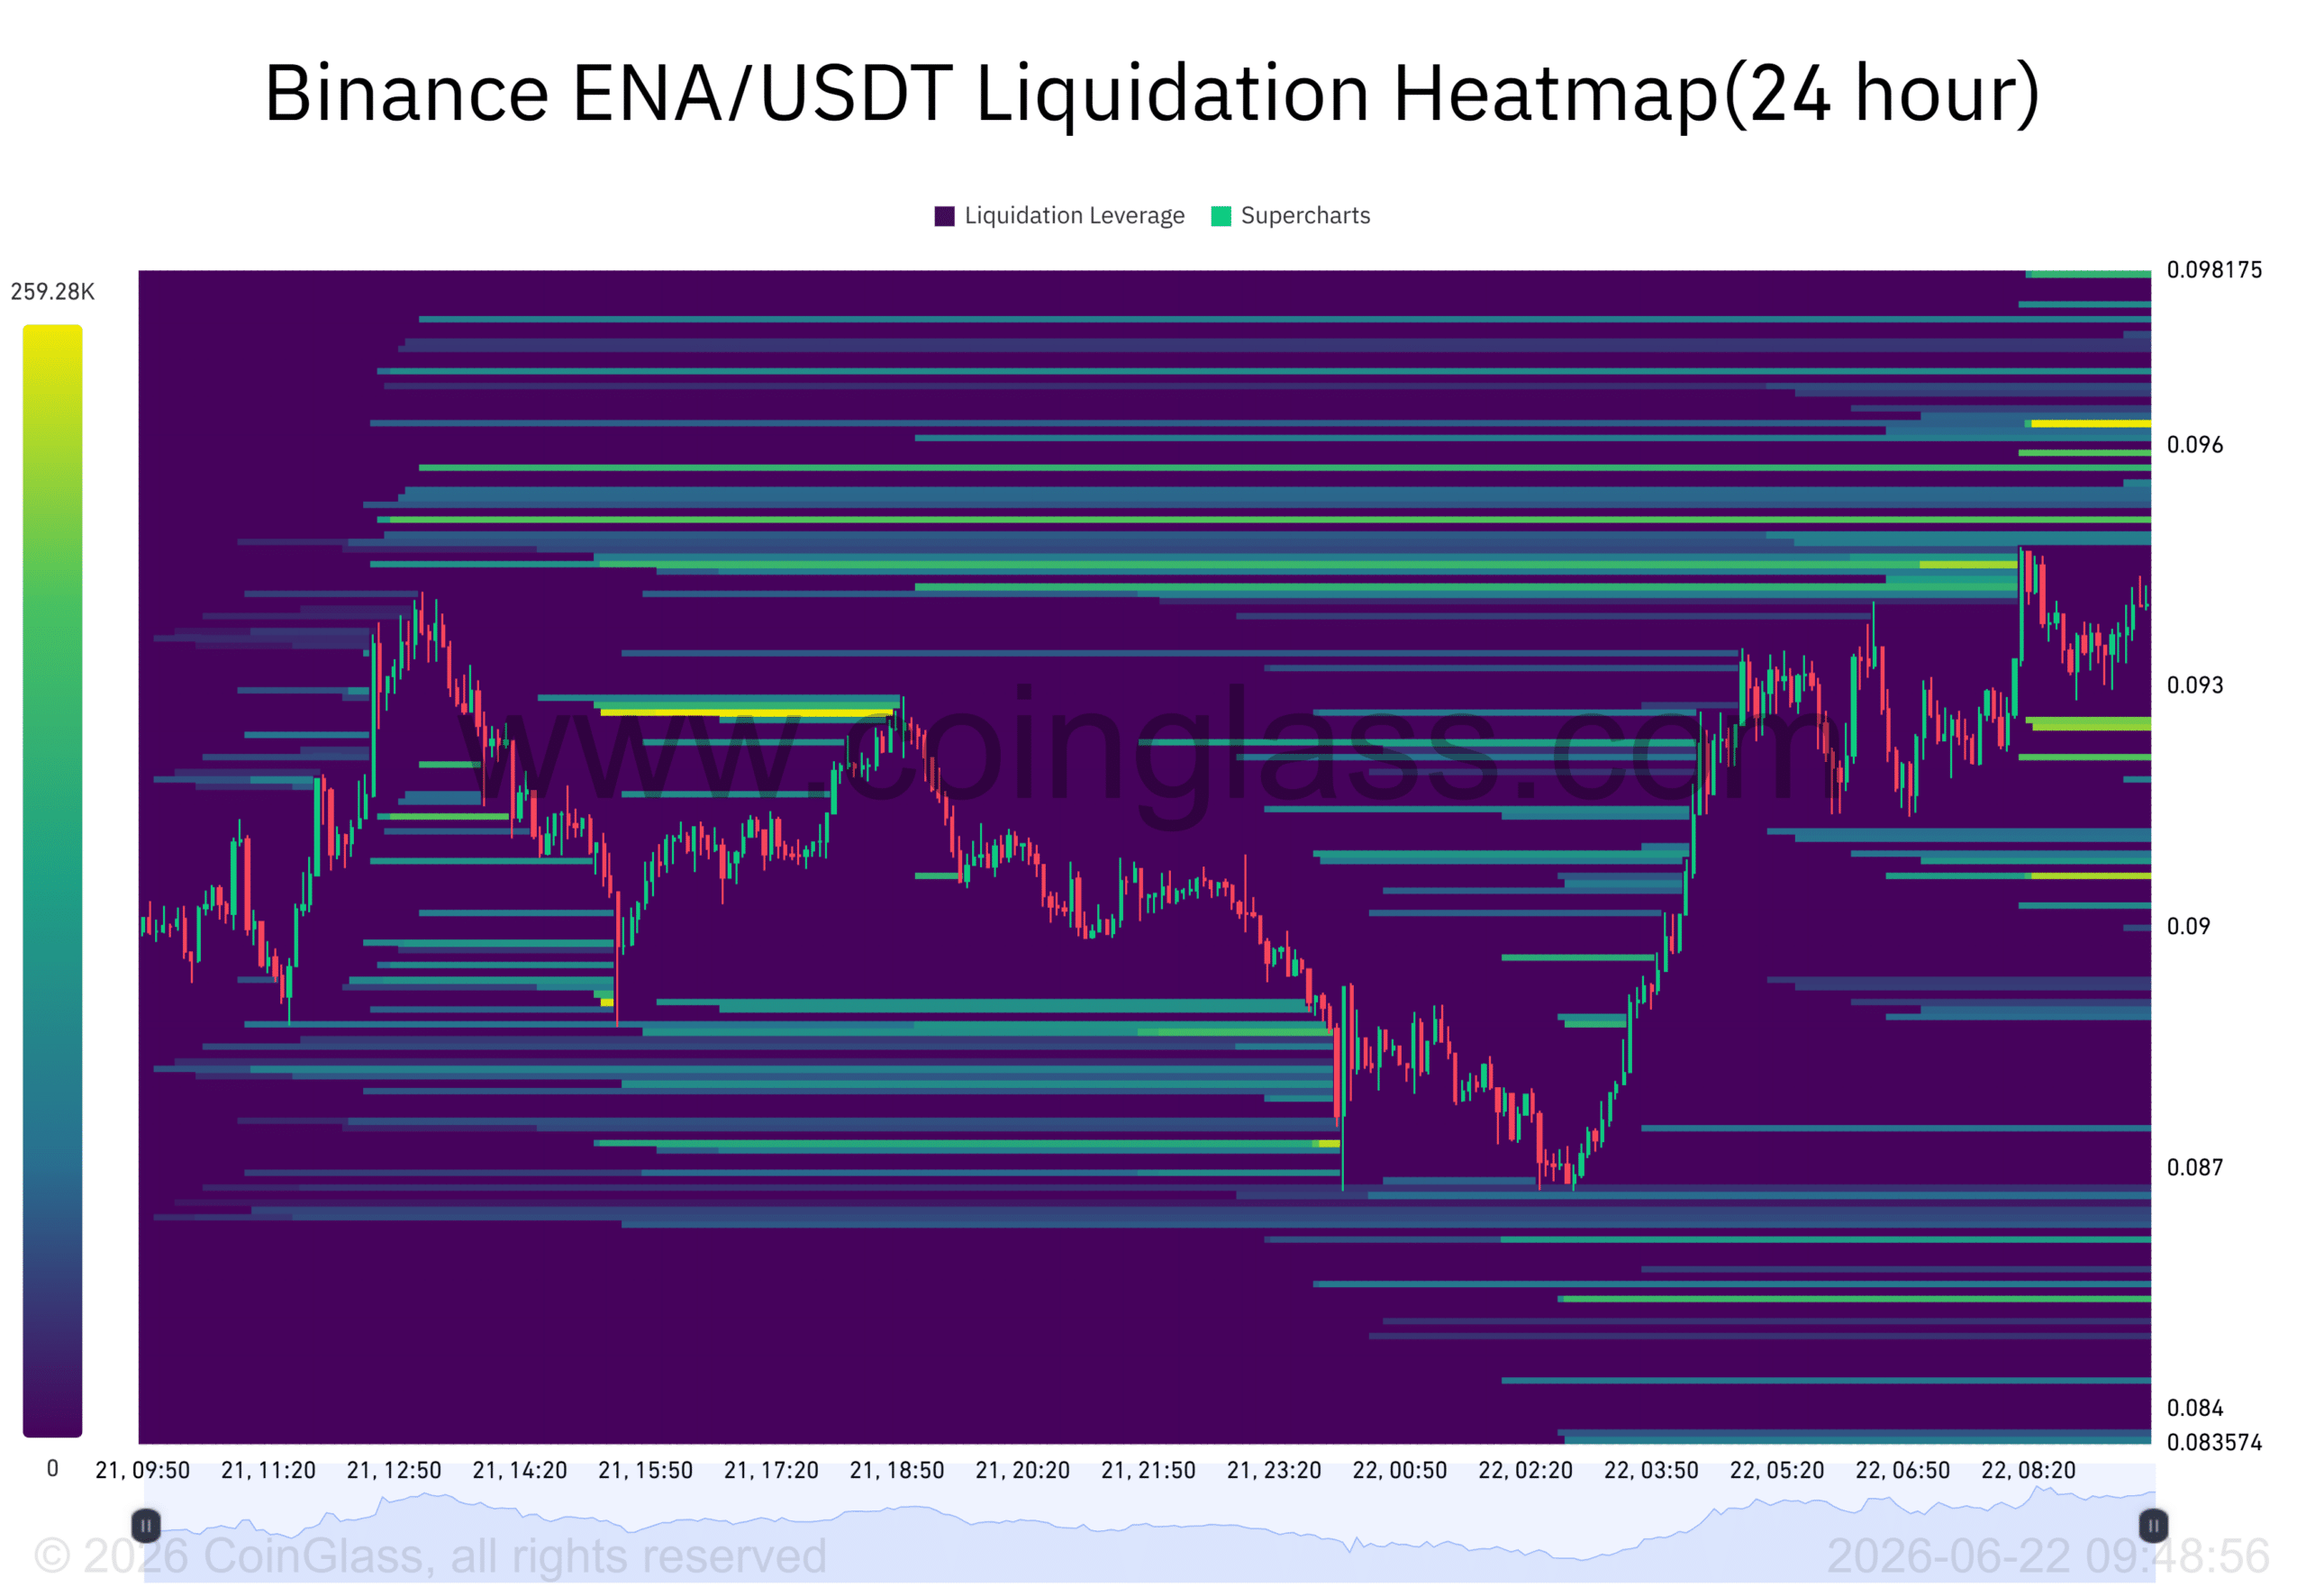
The liquidation heatmap showed cash stacked on both sides of the price, suggesting traders increased their exposure around current levels.
With liquidity accumulating above and below the market, Ethena (ENA) appeared positioned for a volatility-driven move as buyers and sellers battled around neckline resistance.
Final summary
- Ethena gained 4% as daily active addresses reached their highest level since November 2025.
- ENA has approached key resistance at $0.096, where a breakout could strengthen the bullish reversal pattern.