This article is also available in Spanish.
One analyst explained how losing this on-chain demand zone could cause Ethereum to crash all the way to $1,800.
Ethereum is currently retesting a major on-chain support area
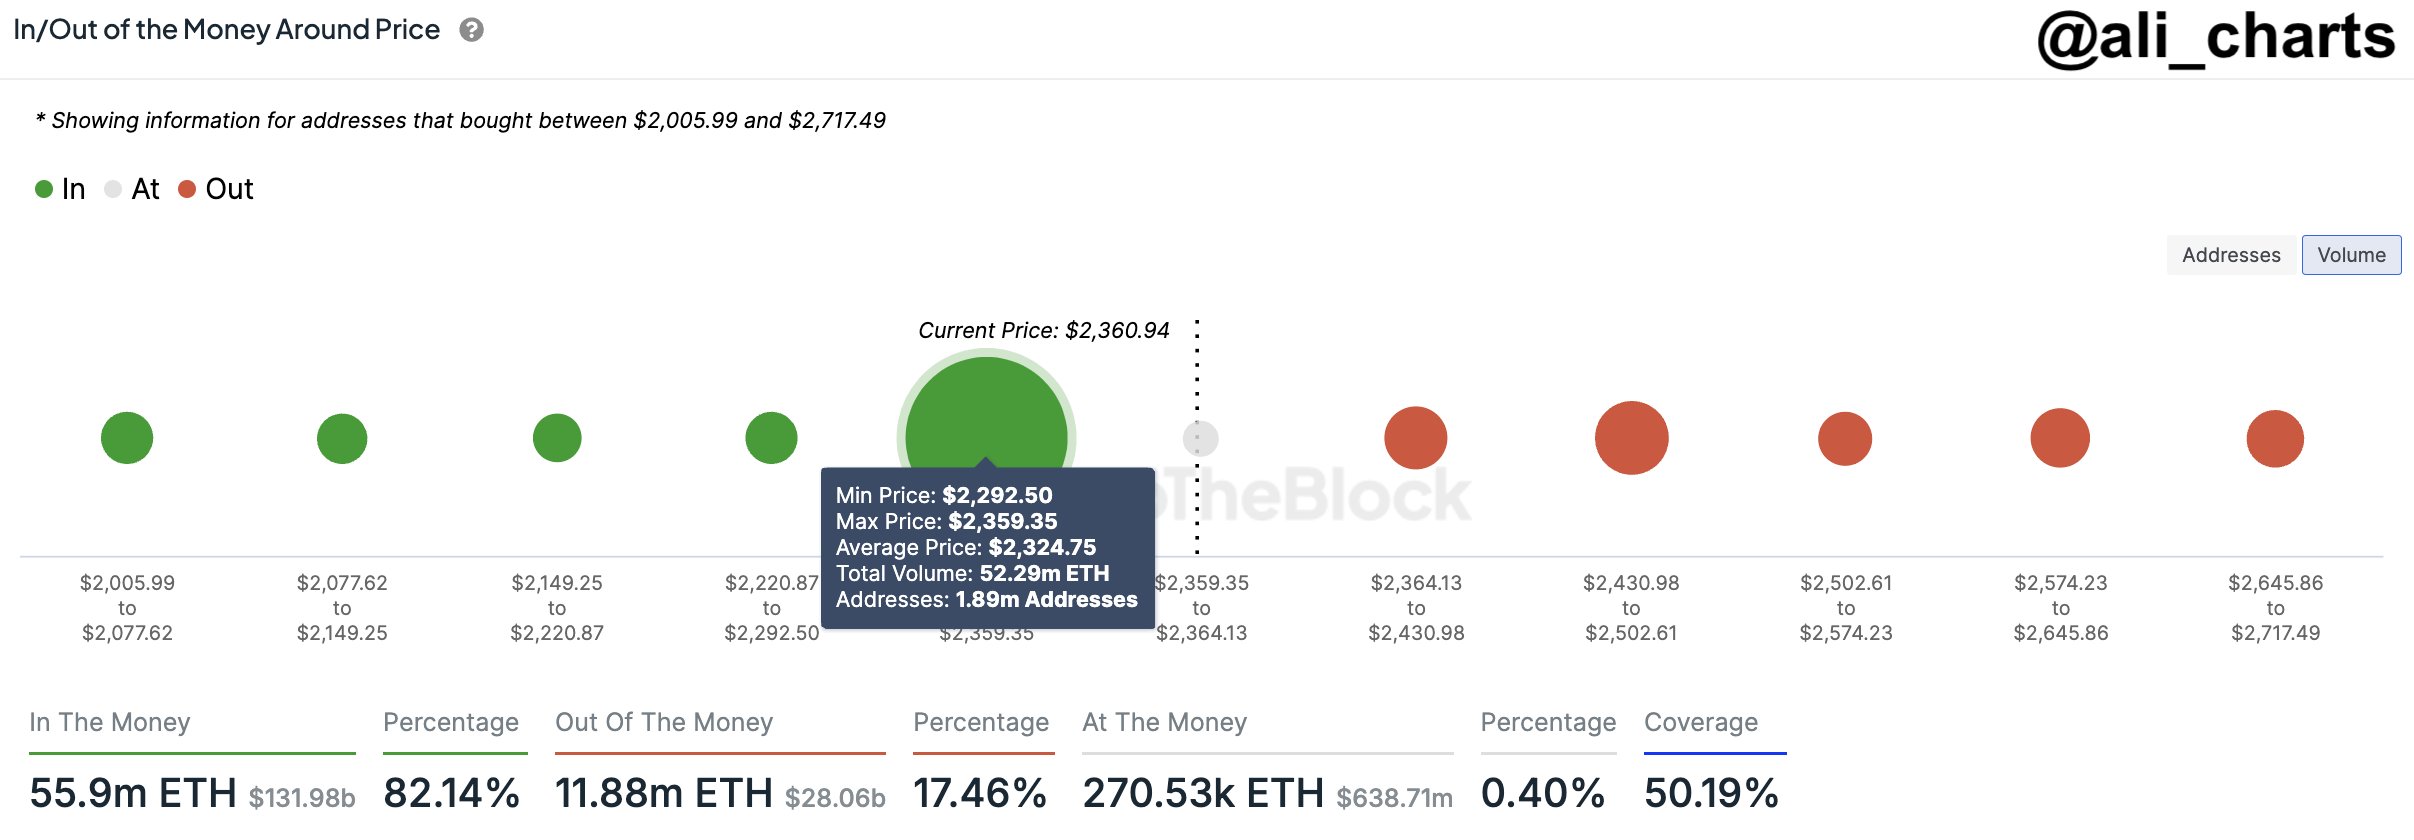
In a new article on X, analyst Ali Martinez explained what Ethereum looks like in terms of investor cost distribution right now, citing data from market intelligence platform IntoTheBlock.

In the chart above, the dots represent the amount of ETH that was last purchased by investors or addresses within the corresponding price range. As can be seen, the range from $2,292 to $2,359 stands out due to the size of its dot, suggesting that significant buying occurred between these levels.
Related Readings
Specifically, nearly 52.3 million ETH were acquired by 1.9 million addresses within this range. Given that Ethereum is currently retesting the range, all of these investors would barely be able to break even on their investment.
For any investor, the base price is naturally an important level and so they may be more inclined to make some sort of move when a retest of that price occurs. However, for ranges that accommodate the acquisition level of a limited number of holders, any reaction resulting from a retest is not very relevant to the market as a whole.
In the case of price ranges corresponding to huge demand areas, however, a retest can lead to visible fluctuations in the asset price. The aforementioned Ethereum range naturally belongs to this category.
As for how exactly a retest of a high demand zone would affect the cryptocurrency, the answer lies in investor psychology. Retests that occur from above, i.e. from investors who were in profit just before the retest, usually produce a buying reaction in the market.
Indeed, these holders may believe that the asset will rise again in the future, and buying more at their cost price may therefore seem like a profitable opportunity. With Ethereum currently retesting the $2,292-$2,359 range, it is possible that it will sense support and find a bounce.
However, in case a break below this zone occurs, the price of the cryptocurrency could be in danger. The chart clearly shows that the ranges below this demand zone only represent the cost basis of a small number of investors, so they may not be able to prevent a further decline in the asset.
Related Readings
“If this demand zone breaks, we could see a massive selloff pushing ETH towards $1,800,” the analyst notes. A drop to that level from the current price would mean a drop of over 21% for the coin.
It now remains to be seen how the price of Ethereum will evolve in the coming days and whether the support zone on the chain will hold.
ETH Price
After retracing its recovery from the past few days, Ethereum is back at $2,300, which is within the aforementioned price range.
Featured image by Dall-E, IntoTheBlock.com, chart by TradingView.com


