


- The BEAM crypto showed signs of a breakout as trading volume increased and the price moved closer to resistance.
- Mixed signals on-chain revealed cautious sentiment, with limited activity from large holders despite growing interest.
Beam (BEAM) trading volume recently jumped 21%, and its price increased 3%. This suggests a potential shift in dynamics.
At press time, the altcoin was trading at around $0.01878, showing signs of upward movement.
However, it remains to be seen whether this momentum can trigger an exit from its consolidation zone.
Is BEAM ready to exit its lineup?
BEAM is trading in a tight range between $0.015 and $0.022, reflecting a period of consolidation. This widened range suggested a balance between buyers and sellers, with neither side gaining an advantage.
However, with the recent increase in volume, BEAM could be preparing to break out of this range. Therefore, a breakout could signal a new trend.
BEAM faced a significant resistance level at $0.02034, which marks the top of its consolidation range. A break above this resistance would likely propel BEAM towards the next major level at $0.03130, offering 65.11% upside potential.
Conversely, the $0.015 support level is crucial to contain any downside, thus strengthening the lower bound of the range.
These levels are therefore essential in determining the next direction of BEAM. If it rises above $0.02034, it could initiate a rally towards the $0.03130 target.
Additionally, the chart indicates that a brief pullback to $0.02034 could serve as a retest. This strengthened support and provided an ideal entry point for traders.
Therefore, this pullback could confirm a lasting breakout, attracting more buyers.
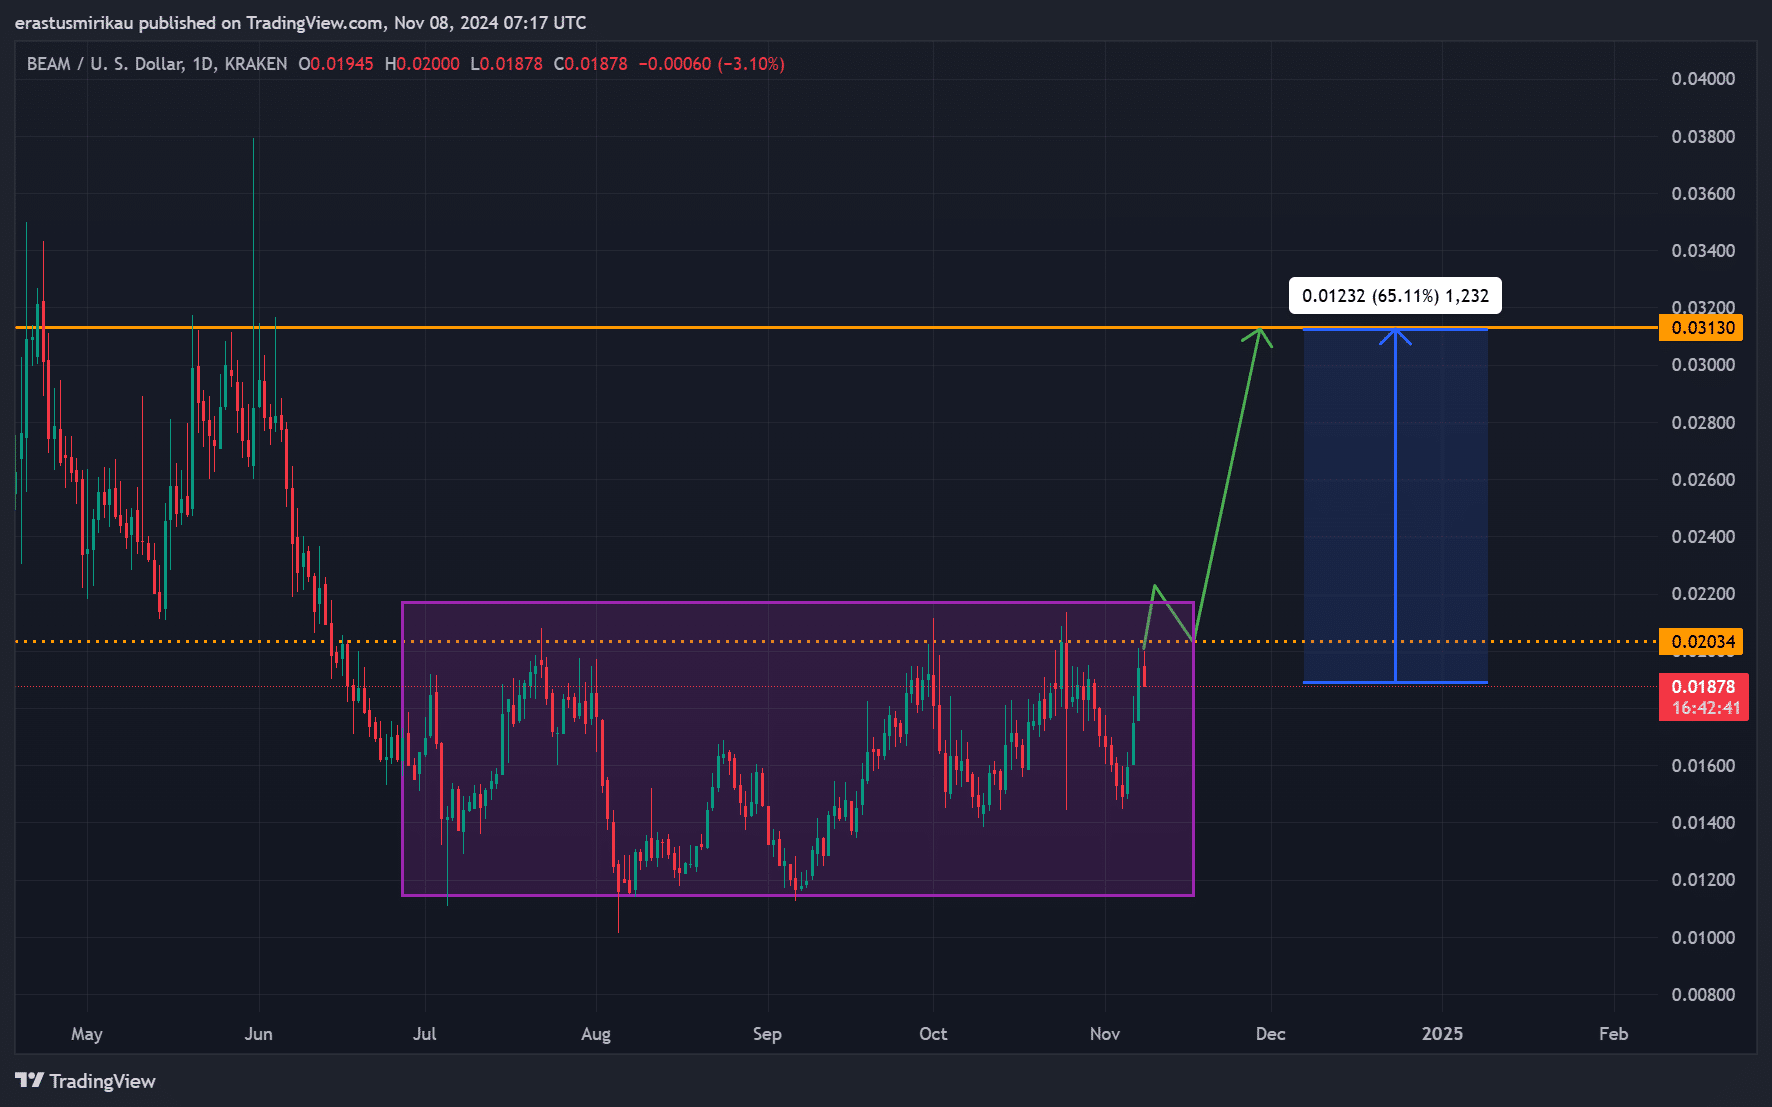
Source: TradingView
BEAM technical indicators show…
Technical indicators offer insight into the dynamics of BEAM, the MACD has recently shown a bullish crossover. This suggests growing momentum.
However, the histogram remains minimal, signaling that the upward movement remains cautious.
Additionally, the Stochastic RSI shows BEAM near overbought levels, indicating a potential short-term pullback before further gains. Therefore, while momentum is building, it is essential to watch for a retest before committing.
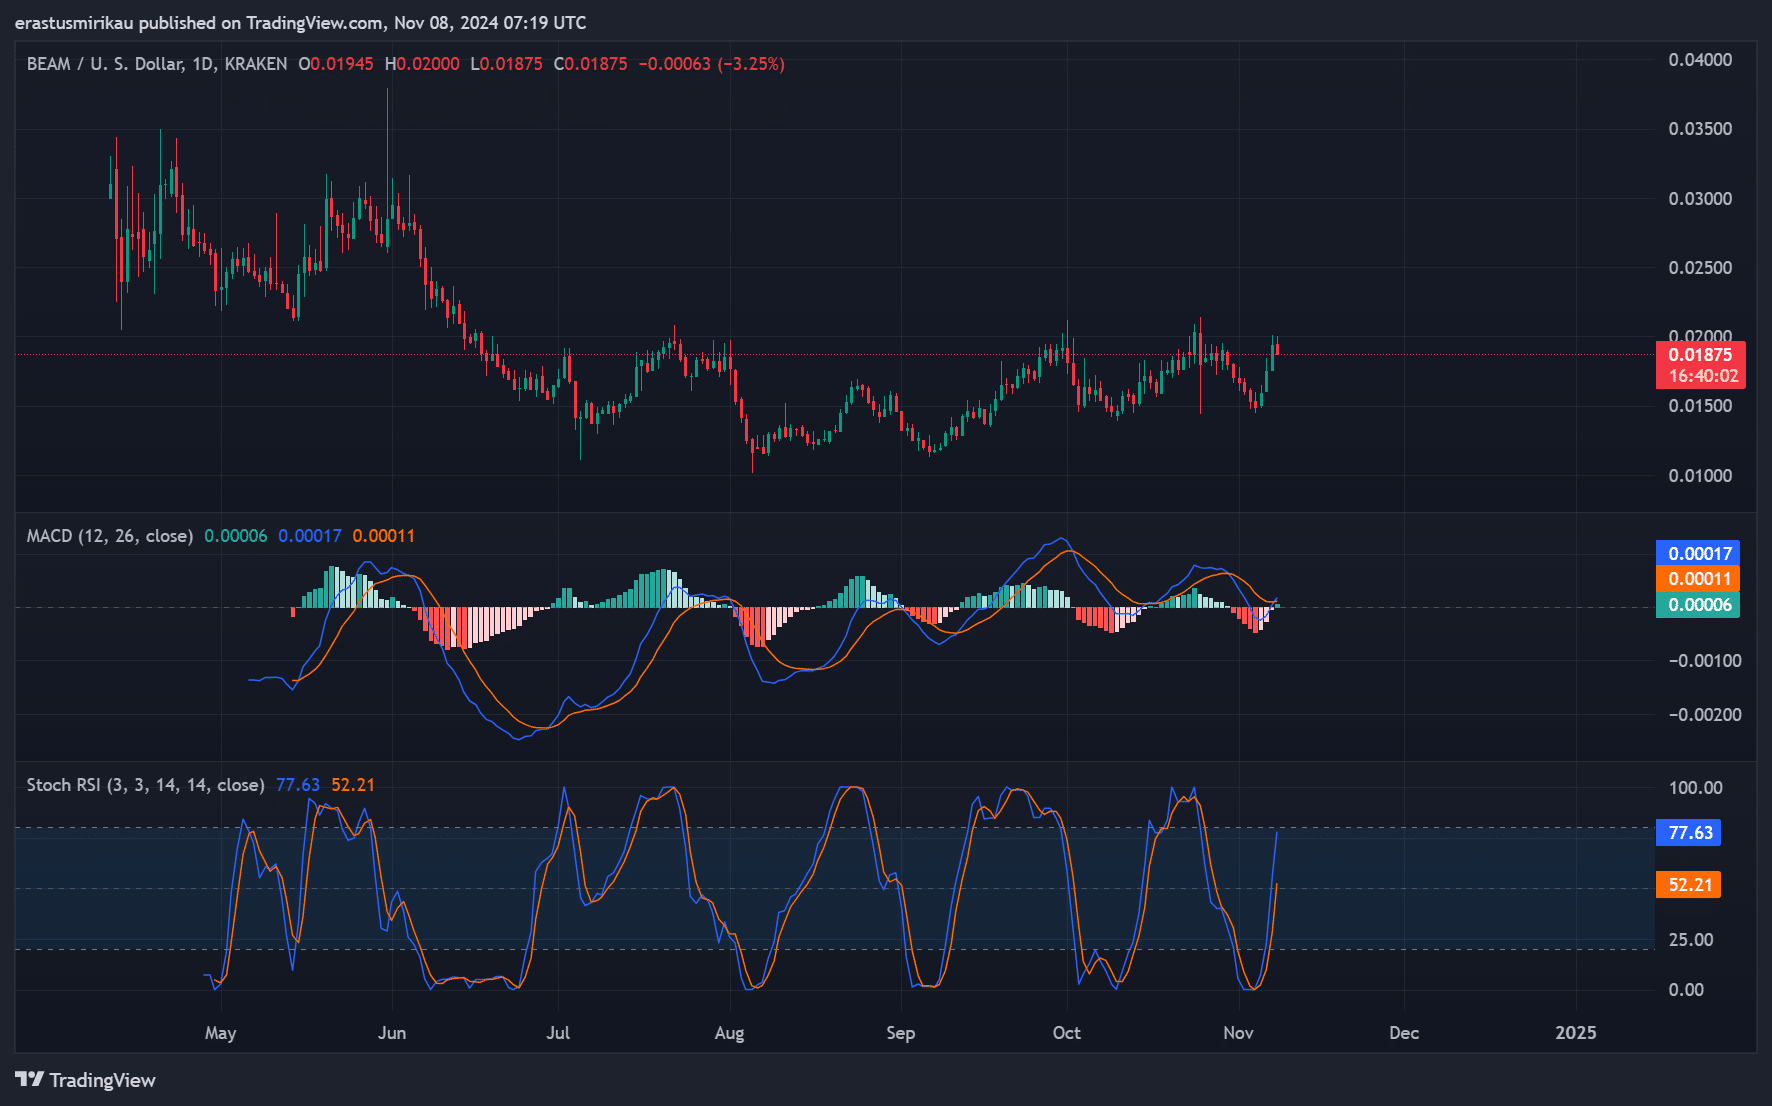
Source: TradingView
Can BEAM Price Rise Without More Address Activity?
The Daily Active Address (DAA) divergence showed a negative reading of 80.3%. This on-chain metric highlights a significant disparity between price action and address activity, often a bearish sign.
Therefore, despite the BEAM price rise, low address activity could challenge the sustainability of the rally.
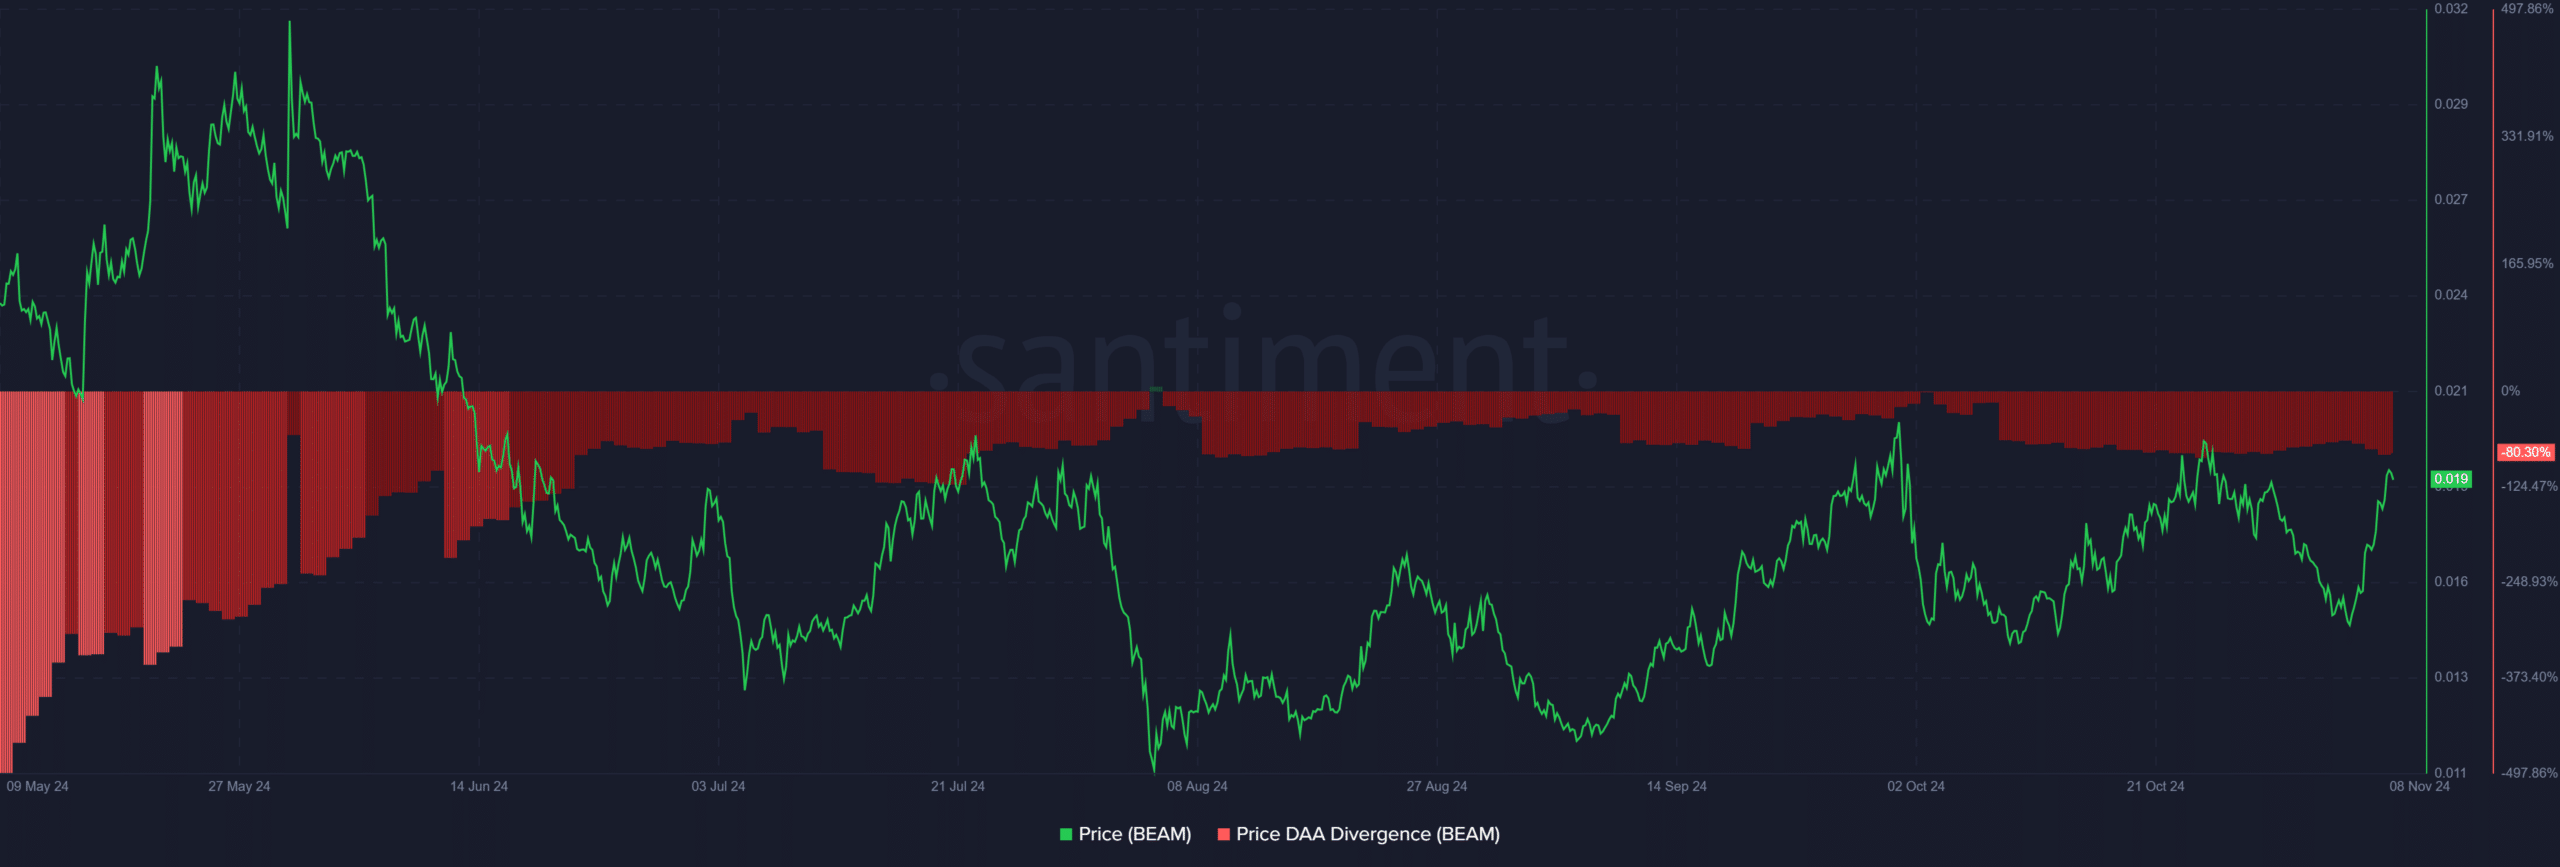
Source: Santiment
Mixed On-Chain Signals: Are Large Holders Cautious?
On-chain data presents a complex picture. The network’s net growth increased by 1.11%, but it is classified as bearish.
Meanwhile, the “In the Money” metric stood at 31.44% in bullish territory. This indicates that many holders are currently profitable.
Additionally, BEAM’s concentration indicator is slightly bullish, while large deals fell by 1.98%, suggesting a decrease in interest from large players.
Therefore, even though retail activity appears strong, large holders appear cautious.
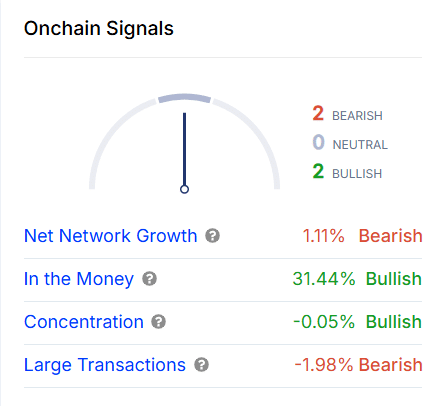
Source: In the block
Realistic or not, here is BEAM market capitalization in BTC terms
Rising volume and price of BEAM indicates growing interest, potentially leading to a breakout. However, with mixed technical and on-chain signals, the breakout scenario requires cautious optimism.
A move above $0.02034 with solid volume could put BEAM on the path to $0.03130, but traders should wait for confirmation at key levels to minimize risks.