Close Menu
Altcoin ObserverAltcoin Observer
  • Regulation
  • Bitcoin
  • Altcoins
  • Market
  • Analysis
  • DeFi
  • Security
  • Ethereum
Categories
  • Altcoins (2,641)
  • Analysis (2,788)
  • Bitcoin (3,396)
  • Blockchain (2,068)
  • DeFi (2,495)
  • Ethereum (2,361)
  • Event (97)
  • Exclusive Deep Dive (1)
  • Landscape Ads (2)
  • Market (2,558)
  • Press Releases (10)
  • Reddit (2,068)
  • Regulation (2,375)
  • Security (3,262)
  • Thought Leadership (3)
  • Videos (43)
Hand picked
  • Maduro’s Crypto-Backed Oil Deals Put Tether at Center of Venezuela Money Drama
  • WLFI under fire as governance vote advances without blocked voters
  • Glassnode Flags XRP Structure Corresponding to February 2022 Pre-Crash Pattern
  • Where is hyperliquid (HYPE) currently? A Deep Dive into Key Indicators Post-2025
  • This New Crypto Just Hit 300% Growth, Experts Say There’s Another 400% Upside
We are social
  • Facebook
  • Twitter
  • Instagram
  • YouTube
Facebook X (Twitter) Instagram
  • About us
  • Disclaimer
  • Terms of service
  • Privacy policy
  • Contact us
Facebook X (Twitter) Instagram YouTube LinkedIn
Altcoin ObserverAltcoin Observer
  • Regulation
  • Bitcoin
  • Altcoins
  • Market
  • Analysis
  • DeFi
  • Security
  • Ethereum
Events
Altcoin ObserverAltcoin Observer
Home»Ethereum»Binance Data Shows Market Reset
Ethereum

Binance Data Shows Market Reset

December 8, 2025No Comments
Share Facebook Twitter Pinterest LinkedIn Tumblr Reddit Telegram Email
Share
Facebook Twitter LinkedIn Pinterest Email


Ethereum reclaimed the $3,150 level after a volatile Sunday session that left traders divided on what’s next. Some analysts are warning that ETH’s recent rally is nothing more than a temporary pause before the downtrend resumes, while others see signs of a potential bullish reversal forming at current levels.

Related reading

New data from Binance reveals that Ethereum is now entering a delicate phase. Price momentum has clearly weakened, but open interest remains relatively high despite the decline from the $3,900 region. This disconnect highlights a major shift in futures market behavior: traders are holding on to their positions, but not aggressively adding to them.

The 30-day Open Interest Z-Score currently sits at 0.50, indicating that OI is just slightly above its 30-day average, well within normal volatility bands. Unlike previous corrections, where open interest surged during sell-offs, the current reading suggests neither extreme leverage accumulation nor panic-driven position closures.

This unusual combination – weakening momentum coupled with stable open interest – highlights a market in transition. Whether Ethereum resumes its downtrend or begins to recover will depend on how quickly momentum returns to the spot and futures markets in the coming days.

Stability in open interest rates signals a repositioning market

According to Arab Chain’s report on CryptoQuant, Ethereum’s $6.61 billion in open interest highlights that traders still hold a substantial portion of their positions despite the sharp decline from $3,900 to below $3,200. This divergence – falling prices but stable OI – is characteristic of market repositioning phases, during which traders reduce their activity without completely leaving the market.

Supporting metrics reinforce this view: OI avg30 stands at $6.44 billion and OI std30 at $329 million, indicating that current fluctuations remain well within normal volatility ranges. There are no signs of aggressive position accumulation or liquidation pressure.

Binance Ethereum Open Interest Z-Score | Source: CryptoQuant

With the Z-Score at 0.50, the modest rise in open interest does not suggest overwhelming bearish leverage. Instead, it shows that traders continue to engage with the market and selectively build new positions as prices decline. This level of participation is important: it signals that the derivatives market is active but not overheated.

Ethereum’s price weakness, caused by fading momentum after failing to maintain previous highs, leaves the market at an inflection point. If large traders are primarily short, stable OI could support continued downward pressure. However, if long positions dominate, this same stability could lay the foundation for a rebound once momentum returns.

Related reading

Testing momentum as bulls attempt to regain control

Ethereum is attempting to stabilize above the $3,150-$3,160 zone after a volatile multi-week decline. The chart shows ETH rebounding from a local low near $2,750, forming a short-term ascending pattern. However, the dynamic remains fragile. The 50-day SMA continues to decline and is well above the current price action, reinforcing the broader downtrend. Until ETH can break through and close above this moving average, upward attempts will likely be met with resistance.

ETH Consolidates Around Key Level | Source: ETHUSDT chart on TradingView

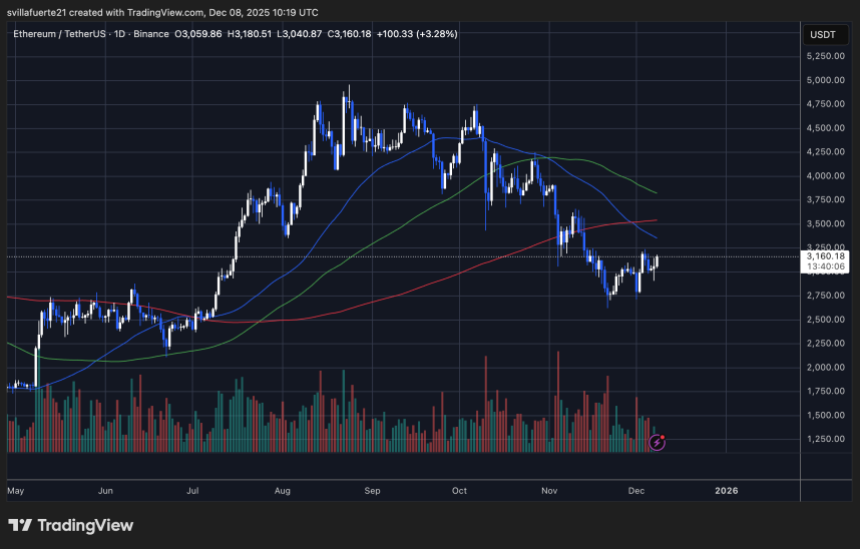
The 100-day SMA is also falling, converging towards the $3,350-$3,400 region, an area that could provide the next major ceiling for any bullish continuation. Meanwhile, the 200-day SMA remains stable but sits just above the price, creating an additional barrier between $3,250 and $3,300. This group of resistance levels confirms that Ethereum is still operating in a corrective structure despite the recent rebound.

Related reading

Volume decreased significantly compared to the strong sales increases seen in November. This suggests that the rebound may be more due to a decrease in selling pressure than strong spot demand. If volume remains low, ETH may struggle to build enough momentum for a sustainable recovery.

Featured image from ChatGPT, chart from TradingView.com


Source link

eth ethereum ethereum analysis ethereum market Ethereum Moment ethereum news Ethereum open interest ethusdt
Share. Facebook Twitter Pinterest LinkedIn Tumblr Email
Previous ArticleExtreme fear returns as Bitcoin plunge drives index to 15
Next Article Citadel’s shot at Andreessen Horowitz hints at a coming battle over DeFi and US stock trading

Related Posts

Ethereum

Ethereum Supply Dynamics Shift as ETH Staking Sees Historic Growth – Here’s the Number

January 20, 2026
Ethereum

Is Ethereum about to break through $4,000? Expert identifies on-chain triggers of potential rally

January 20, 2026
Ethereum

Checkpoint #8: January 2026 | Ethereum Foundation Blog

January 20, 2026
Add A Comment
Leave A Reply Cancel Reply

Single Page Post
Share
  • Facebook
  • Twitter
  • Instagram
  • YouTube
Featured Content
Event

Digital Assets Forum Expands to Two Days in London, Uniting Traditional Finance and the Digital Assets Industry

January 16, 2026

Following two sold-out editions, Europe’s premier digital assets conference returns to London, doubling in size…

Event

Solana Accelerate Joins Consensus Hong Kong, Bringing Web3’s Most Dynamic Community to Asia’s Premier Crypto Gathering

January 14, 2026

HONG KONG, Jan. 8, 2026 — CoinDesk, the leading media, events, indices, and data platform…

1 2 3 … 70 Next
  • Facebook
  • Twitter
  • Instagram
  • YouTube

Glassnode Flags XRP Structure Corresponding to February 2022 Pre-Crash Pattern

January 21, 2026

Portugal blocks Polymarket due to political betting

January 21, 2026

Bermuda partners with Circle and Coinbase to become world’s first ‘chain economy’

January 20, 2026
Facebook X (Twitter) Instagram LinkedIn
  • About us
  • Disclaimer
  • Terms of service
  • Privacy policy
  • Contact us
© 2026 Altcoin Observer. all rights reserved by Tech Team.

Type above and press Enter to search. Press Esc to cancel.

bitcoin
Bitcoin (BTC) $ 89,359.00
ethereum
Ethereum (ETH) $ 2,978.11
tether
Tether (USDT) $ 0.998904
bnb
BNB (BNB) $ 880.46
xrp
XRP (XRP) $ 1.90
usd-coin
USDC (USDC) $ 0.999798
tron
TRON (TRX) $ 0.298234
staked-ether
Lido Staked Ether (STETH) $ 2,975.27
dogecoin
Dogecoin (DOGE) $ 0.125452
figure-heloc
Figure Heloc (FIGR_HELOC) $ 1.03