


Bitcoin price exceeds $100,000, but people are talking about crypto Star Wars – what is it? How Do Lightsabers Affect BTC Price Movements?
Bitcoin .cwp-coin-chart path svg { stroke: ; line width: ; }
![]()
![]()
Price
Trading volume in 24 hours
Last price movement over 7 days
has surpassed $100,000 per coin, a highly anticipated milestone for the global cryptocurrency community. A few hours later, we saw a considerable drop to $90,500. And now the big question is: what information does price analysis provide traders? And what does Star Wars have to do with it?
a Darth Maul to remove high leverage air pockets, to consolidate before the next upward move. pic.twitter.com/3fi5nB2HjO
– Adam Back (@adam3us) December 5, 2024
DISCOVER: What is Blockchain Gaming?
What does the price of Bitcoin have to do with Star Wars cryptography theory? Discover It means Darth Maul Doji
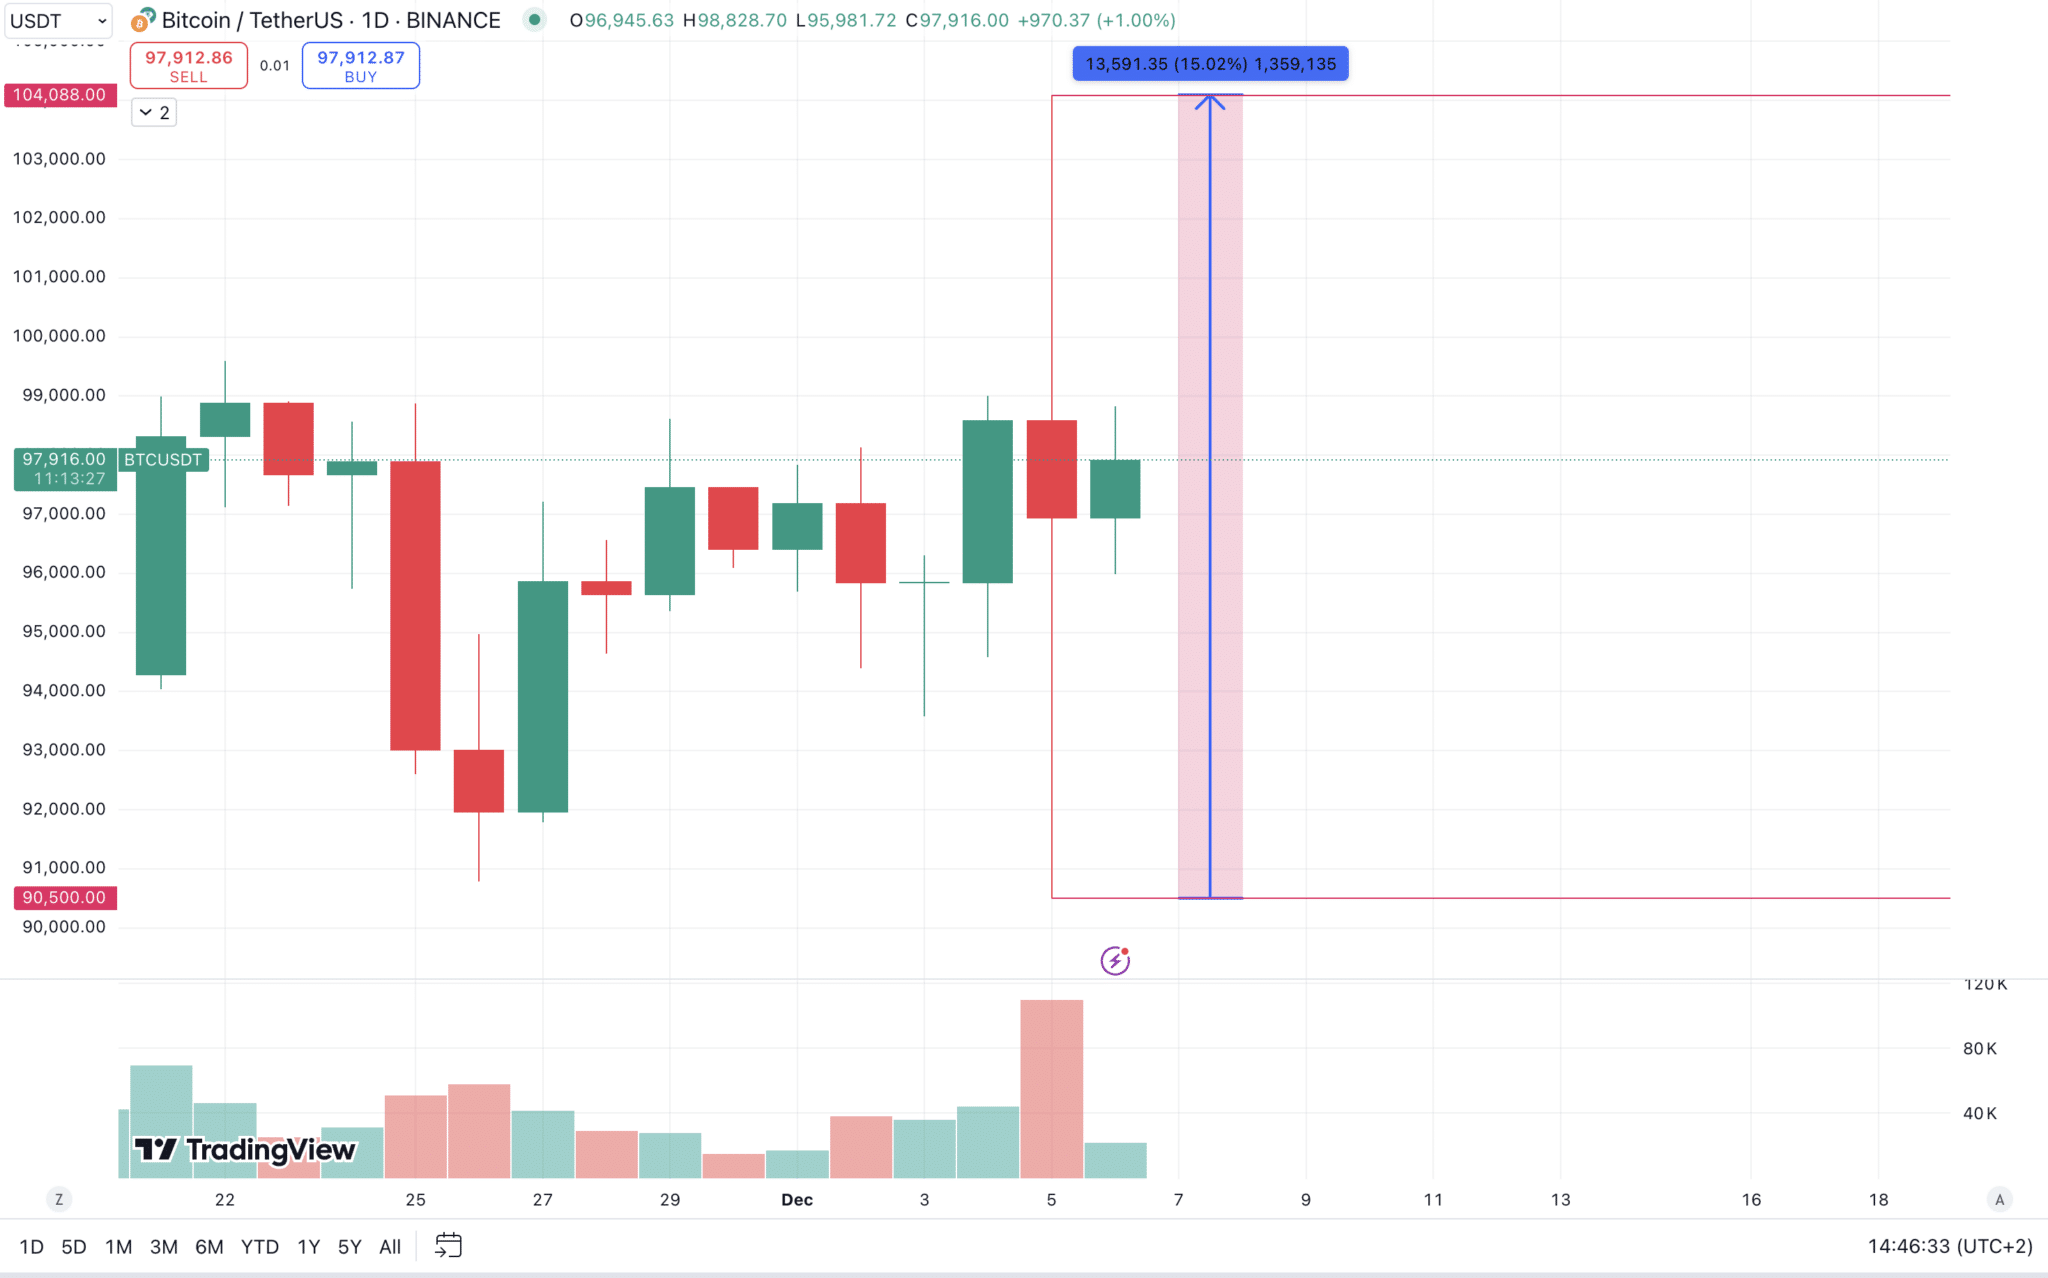
I’m bringing Star Wars because of the specific candle we closed with yesterday: a doji. But not just any doji: a Darth Maul doji. Its name comes from Darth Maul’s double-sided lightsaber.
(BTC/USDT)
Doji alone means nothing in trading other than indecision in the markets. The Darth Maul doji candles, however… This usually means people have received a rekt.
And not just bears or bulls, but both – hence Darth Maul’s double-sided red lightsaber.
Bitcoin’s massive doji defied a 15% swing and nearly $14,000 yesterday. A total of $1.09 billion was liquidated in the futures markets. Only 29% of these came from short positions, meaning the majority of liquidations came from long positions.
However, the current total open interest in the markets stands at almost $130 billion. This means that yesterday’s wipe was not as massive as we would like. Not because we want people to lose money. However, as market makers seek liquidity, liquidations provide it, which could potentially cause a larger liquidation.
(BTC/USDT)
Could Fibonacci retracements shed light on BTC price action?
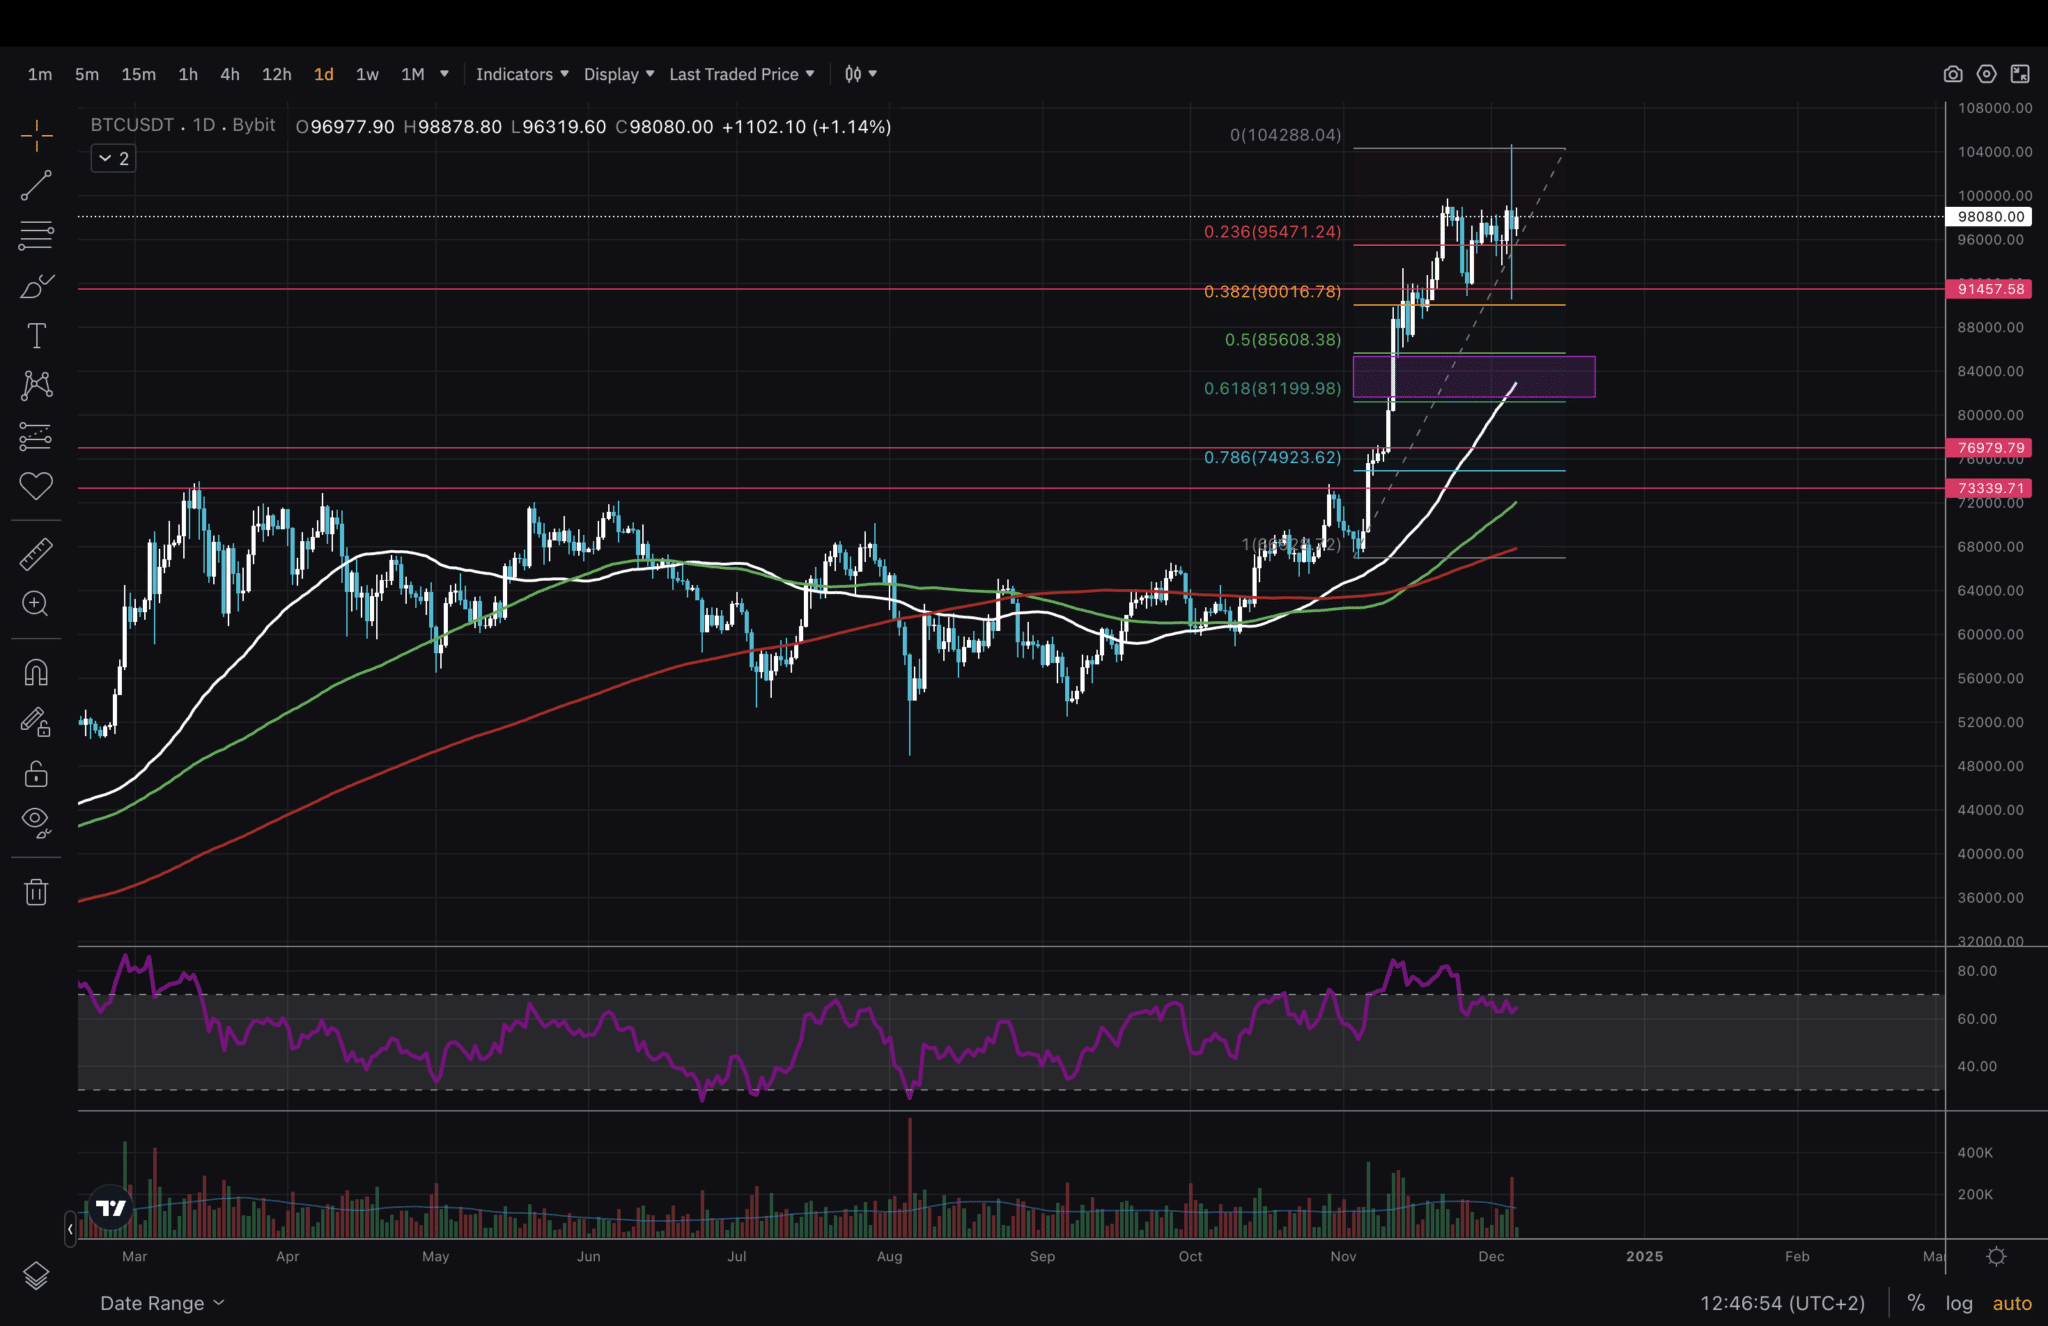
I have drawn two possible Fib retracements for the huge move traders saw in November. The above is the first option, in which I placed the retracement to yesterday’s high. Here the levels don’t really match the chart well. But 0.5 and 0.618 correspond to the fair value gap (FVG) formed after we entered price discovery.
Now let’s see the following way to plot the retracement.
(BTCUSDT)
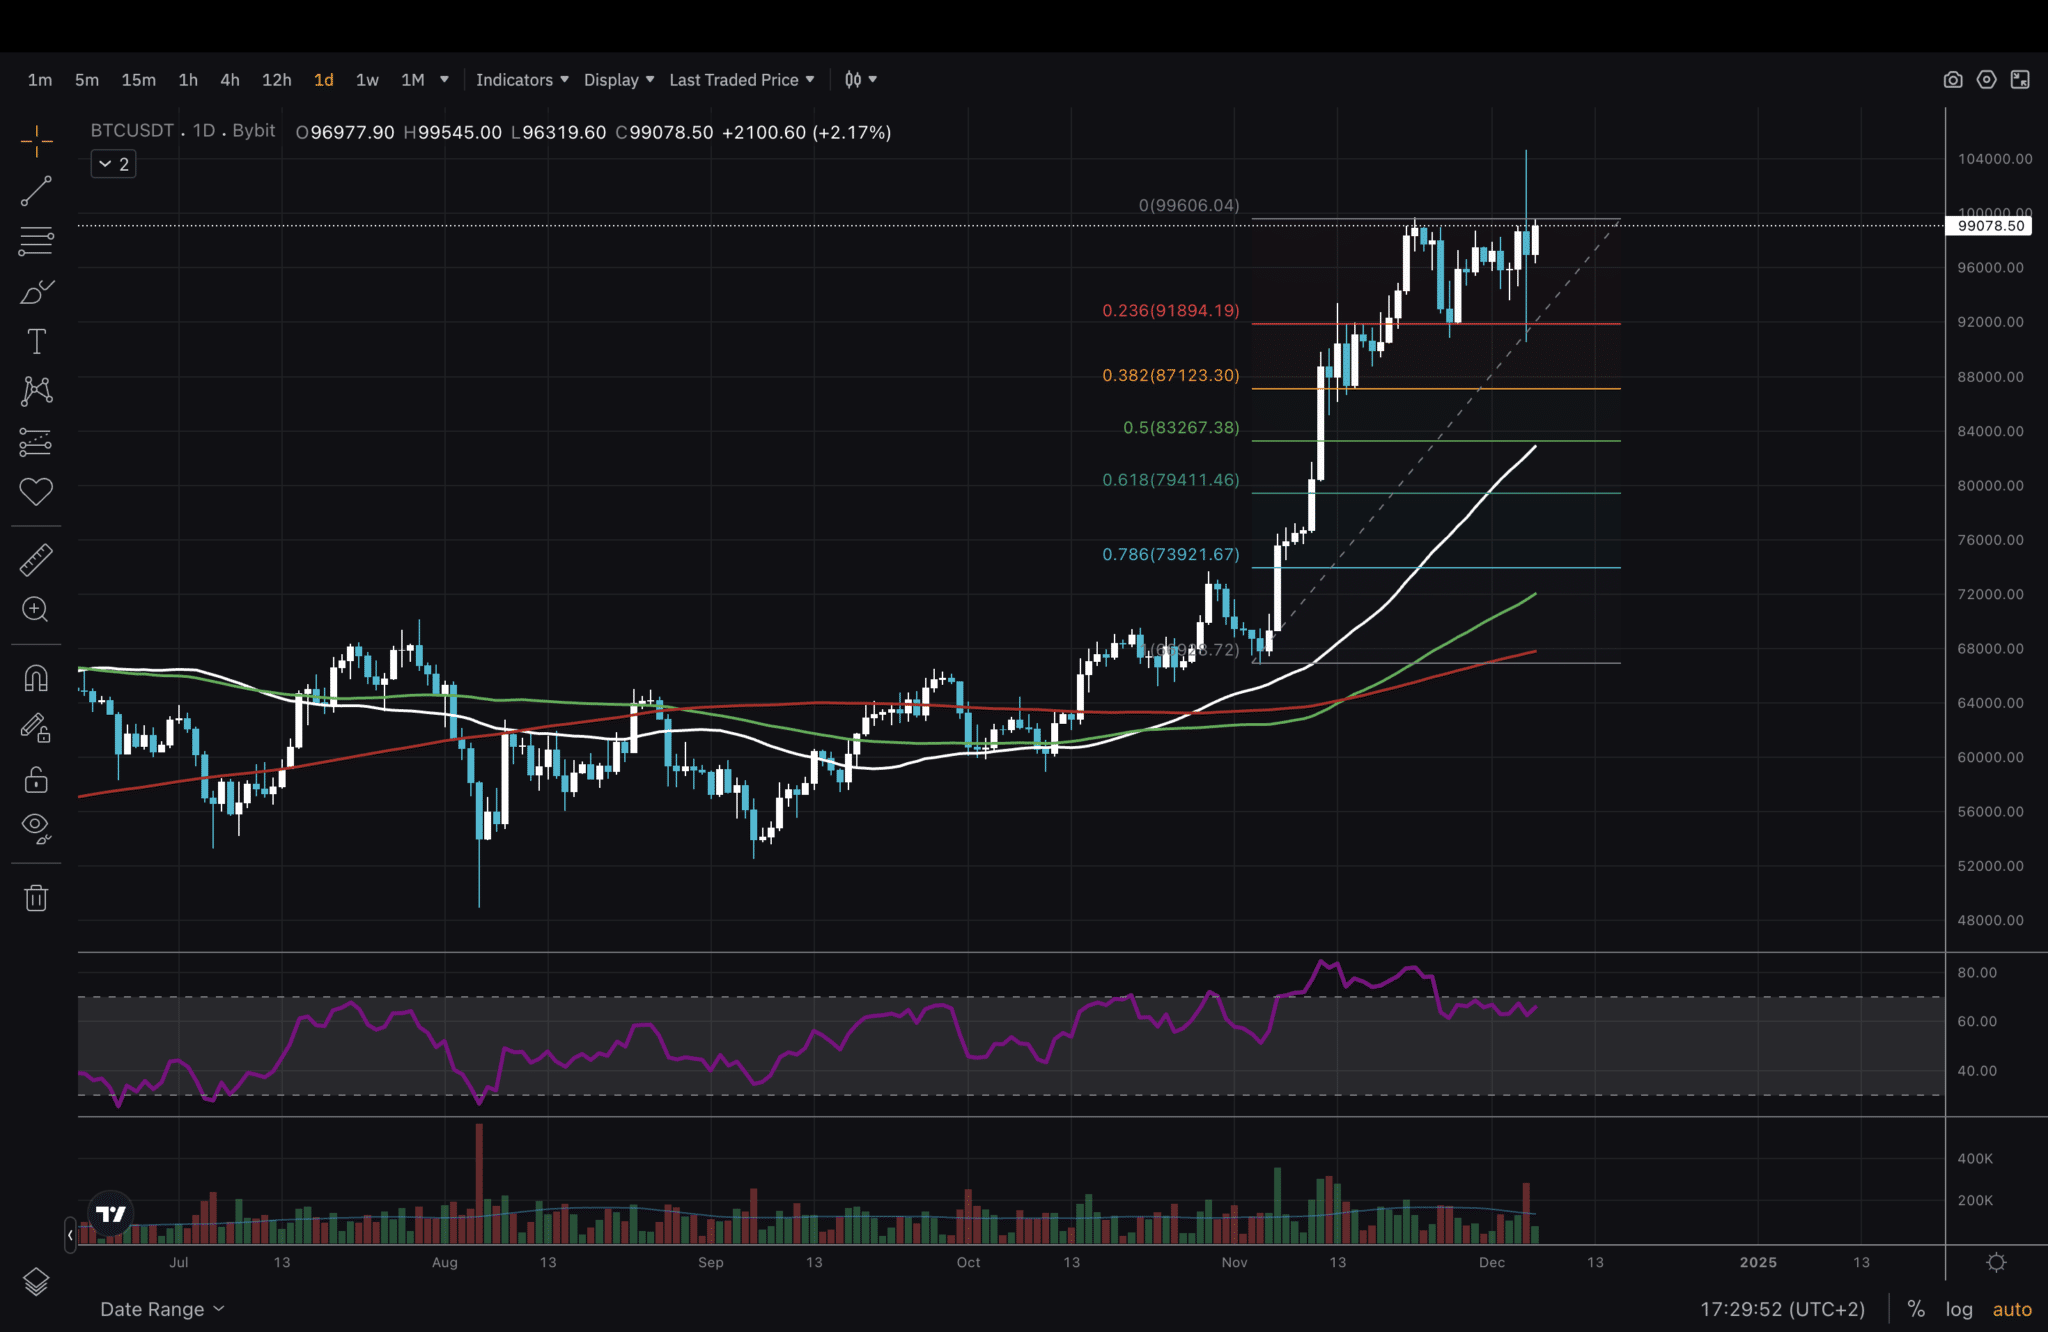
We can see some key levels in the Bitcoin price chart. Our previous and current support level is between $91,500 and $92,000.
Now this retracement reaches almost $100,000, and we can see that 0.236 and 0.382 align very well with the support levels. And 0.5 is around the middle of the FVG.
Whether this gap will be filled is debatable, as is this approach to reading the chart. Some argue that such a phenomenon does not exist, while others mainly trade thanks to it.
This article focuses on trading around Fib levels and moving averages, so we will not participate in the FVG discussion. There is still a lot of open interest in the markets, and some Fibs and MAs have not been retested. Will there be a heavier flush? No one knows, but it’s good to be prepared.
Happy trading and stay safe!
EXPLORE: How to earn Bitcoin in 2024
Join the 99Bitcoins News Discord here for the latest market updates
The post Bitcoin at 100K and lightsabers? When Star Wars Infiltrates BTC Price Action appeared first on 99Bitcoins.