


Brief
- Bitcoin has fallen 52.44% from its October all-time high, coming dangerously close to the 2018 bear market decline of 56.26%.
- The crypto market lost 1.33% in the last 24 hours, with a total market cap of $2.33 trillion.
- On Myriad, prediction market traders say there is a 60% chance BTC hits $55,000 before $84,000.
The crypto market is bleeding. And the injuries keep getting worse.
Bitcoin is trading at $67,621 today, down 1.70% in the last 24 hours. But it’s not just another bad day: it could potentially help mark one of the most prolonged bearish periods in Bitcoin history.
If February ends in red, Bitcoin will experience five straight months of losses, the longest streak since June 2018, when Bitcoin was down for six months. With February already down 13.98%, the signs are not promising.
Cumulative losses since the all-time high in October 2025 now reach 52.4% over 123 days. For perspective, the previous longest losing streak – that nightmare of 2018 – saw a decline of 56.26% over 153 days. Bitcoin is only 3.82 percentage points away from matching this record in less time.
The total cryptocurrency market cap stands at $2.33 trillion, down 1.33% over the past 24 hours. The fear and greed index increased slightly, from 8 to 12 points, but still in “extreme fear”.
The macroeconomic context seems equally fragile. The S&P 500 and Nasdaq fell amid nervousness in the technology sector after Microsoft lost about 10% despite strong profits, spooking investors. Meanwhile, precious metals have become volatile: On January 30, silver futures plunged about 31%, their biggest one-day decline since 1980, while gold also retreated from recent highs.
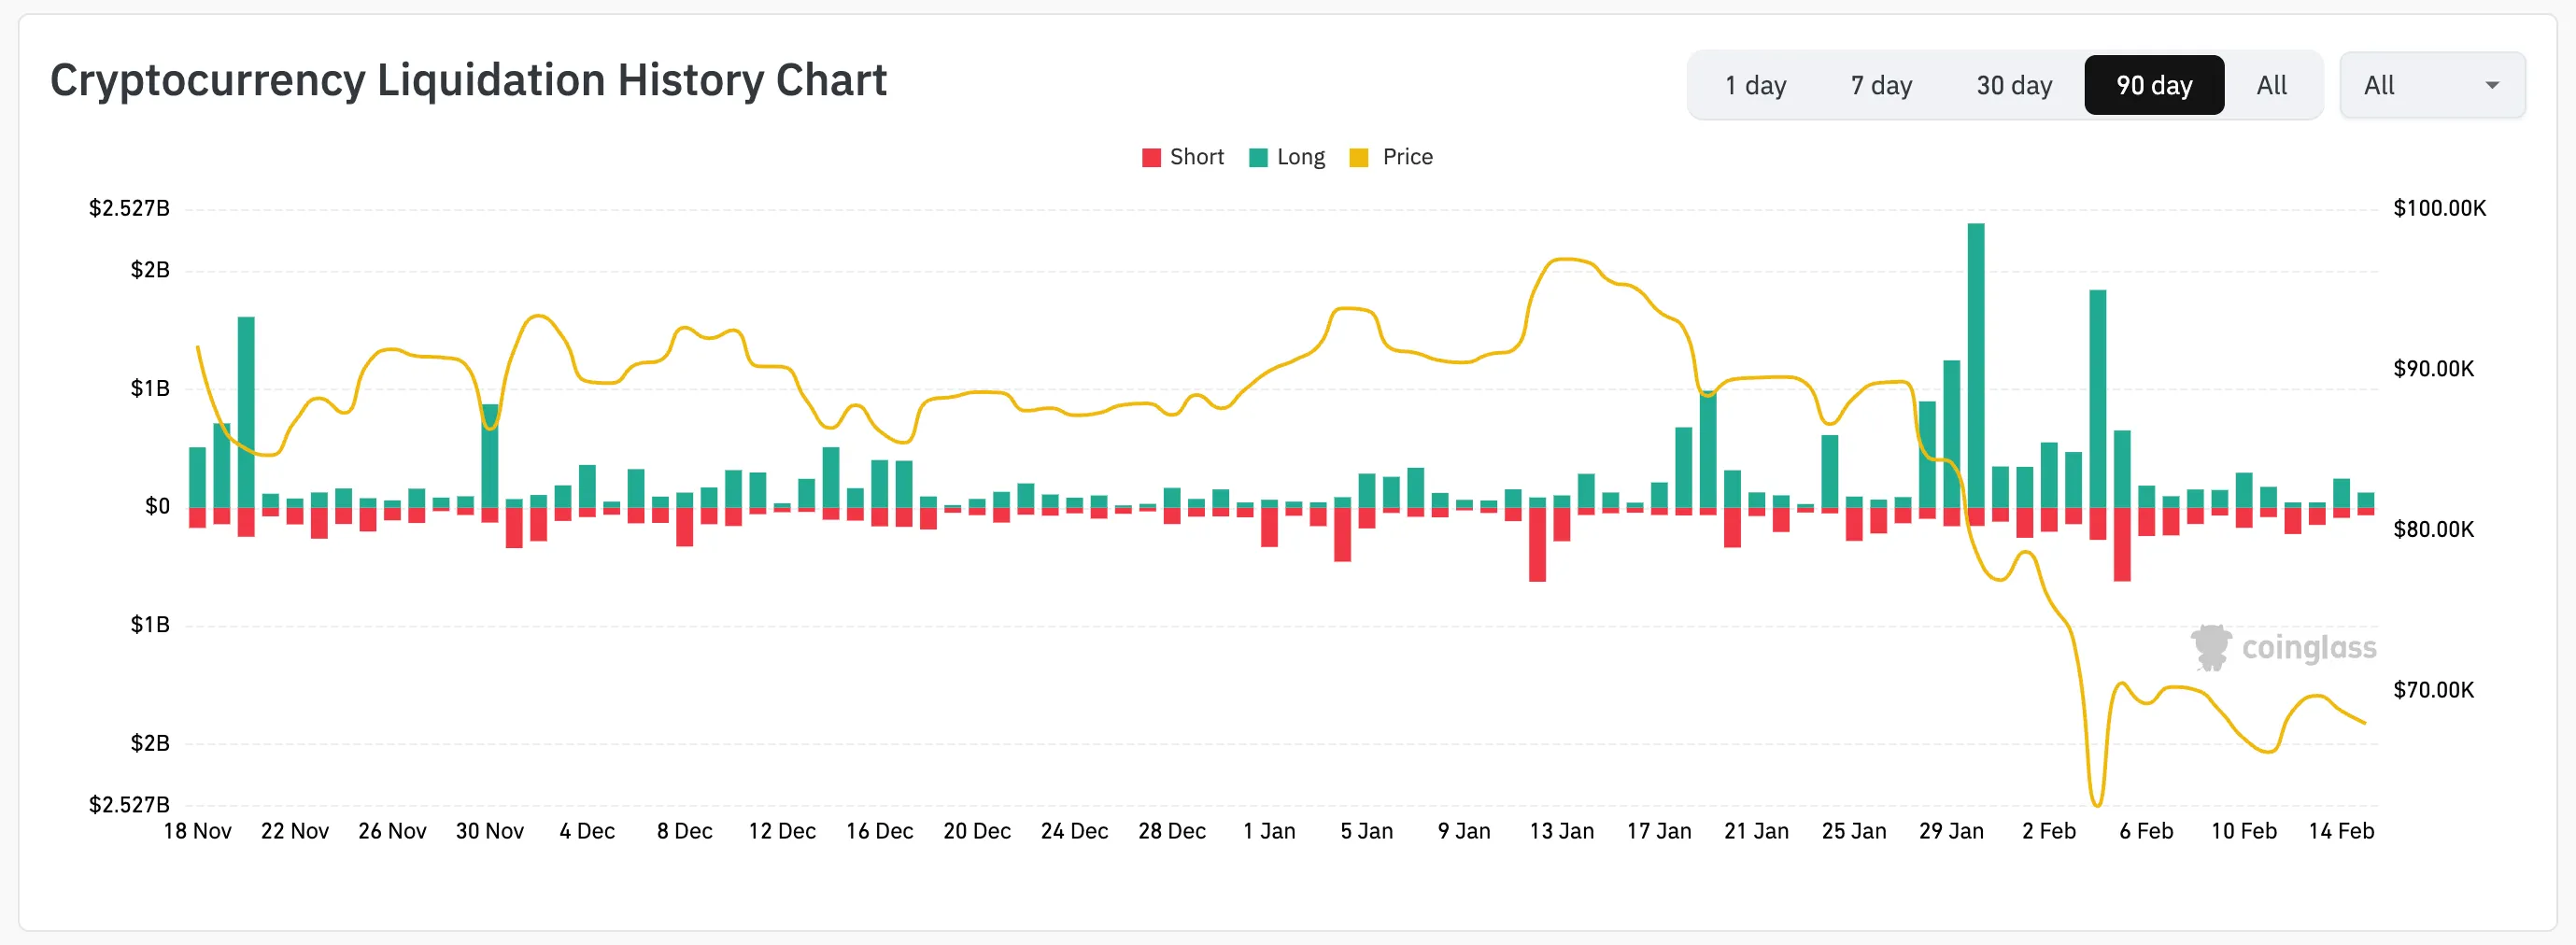
Forced liquidations – when derivatives traders’ positions are automatically closed at certain prices – continue to disrupt the market. Since January 12, according to Coinglass data, there has not been a single day where bearish liquidations have beaten bullish positions.
Speaking of bearish sentiment. On Myriad, a prediction market developed by DecryptDastan, Bitcoin’s parent company, odds have gone from bullish to bearish on bets on Bitcoin’s near-term future. Currently, prediction market traders favor a scenario in which BTC hits $55,000 before $84,000 with 60% odds. This shift in sentiment in prediction markets – where participants put money behind their opinions – is hard to ignore.
Bitcoin (BTC) Price Analysis: Signals Don’t Lie
Bitcoin’s charts paint a similarly bleak picture on the daily timeline. Bitcoin is currently trading sideways after the February 6 peak. However, the price was unable to resume an upward trend and remains below the average price of the last 200 days, which traders identify as the EMA200. This shows how weak the bulls are currently.
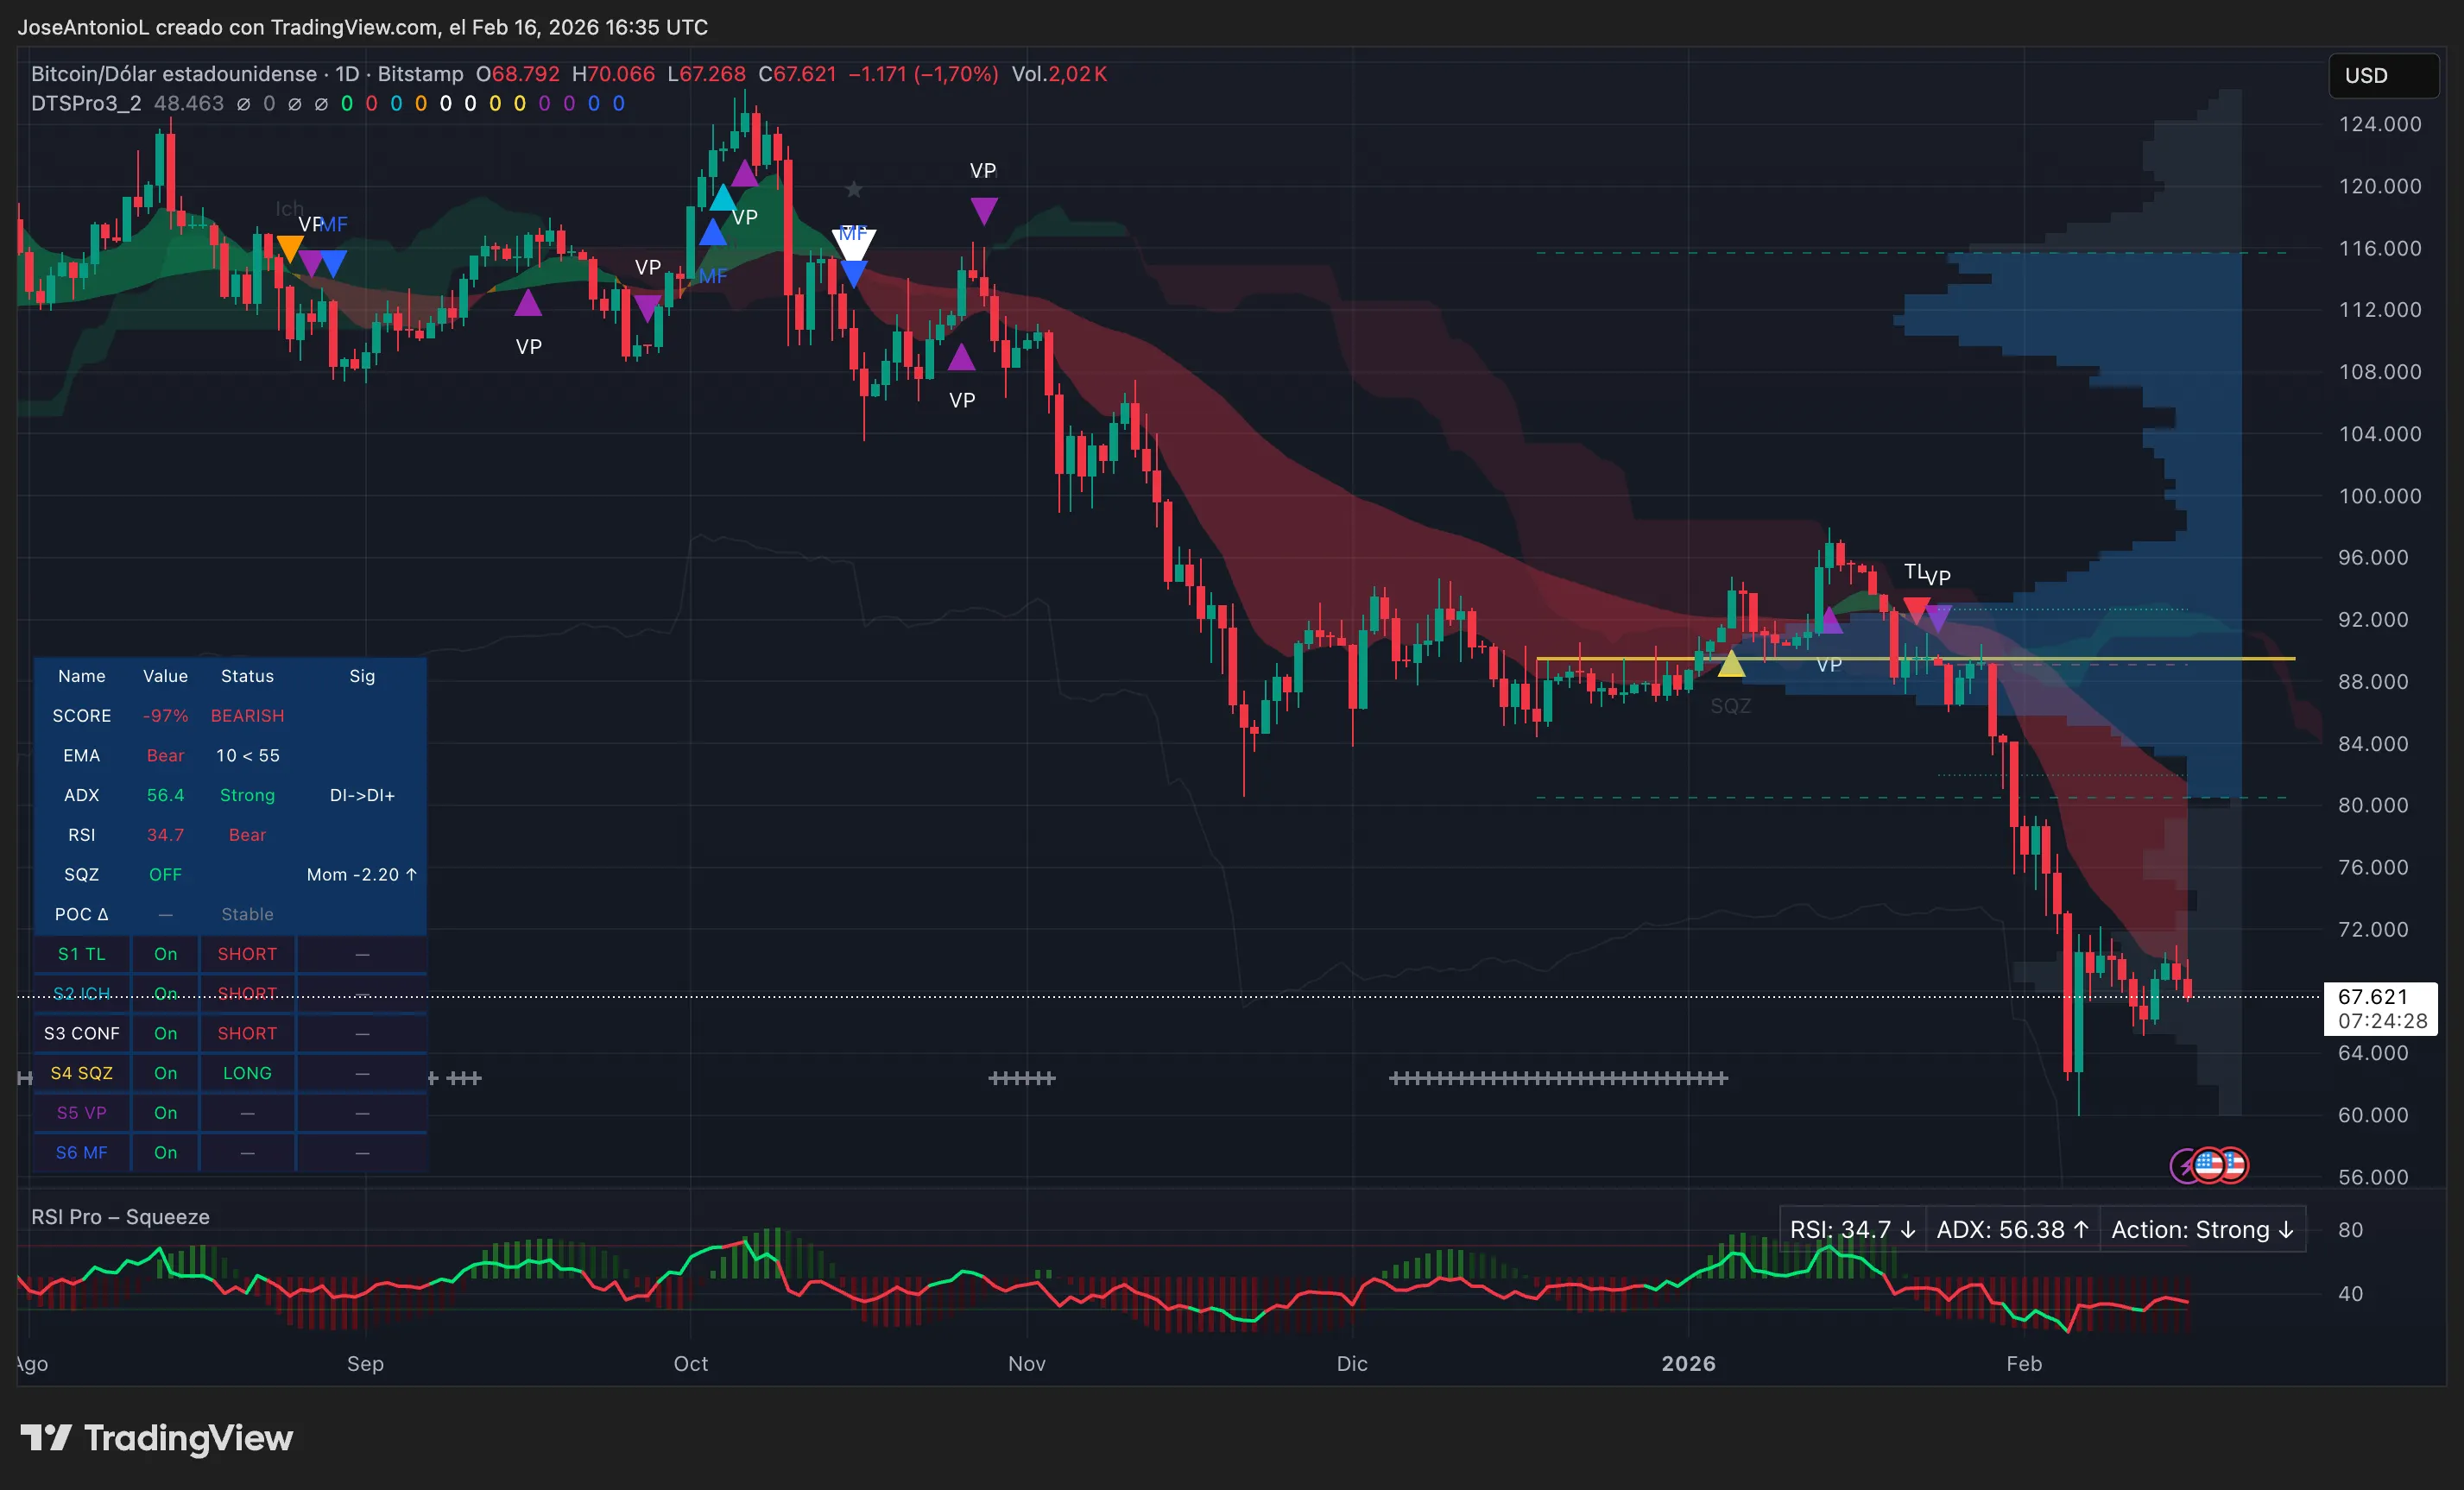
This pattern (the current price is trading below the EMA200 and is below the average price of the last 50 days, or EMA50) generally signals strong bearish momentum. When both EMAs, also known as exponential moving averages, are above the current price, they act as dynamic resistance levels where sellers tend to appear.
The relative strength index, or RSI, stands at 34.7. The RSI measures buying and selling momentum on a scale of 0 to 100. An RSI of 34.7 places Bitcoin in bearish territory, although it has not reached extreme oversold levels. This means that negative momentum dominates, but there is still room for further declines before technical conditions suggest a rebound.
The average directional index, or ADX, stands at 56.4, well above the threshold of 25 which confirms the strength of the trend. ADX measures trend strength with readings above 25, indicating that a strong trend is in place. With the ADX at 56.4 and the price falling, this confirms that the downtrend has very strong momentum.
Can Bitcoin recover?
A rebound in Bitcoin after such a sharp fall is entirely possible, but even if it were the case, it would be premature to talk about a trend reversal.
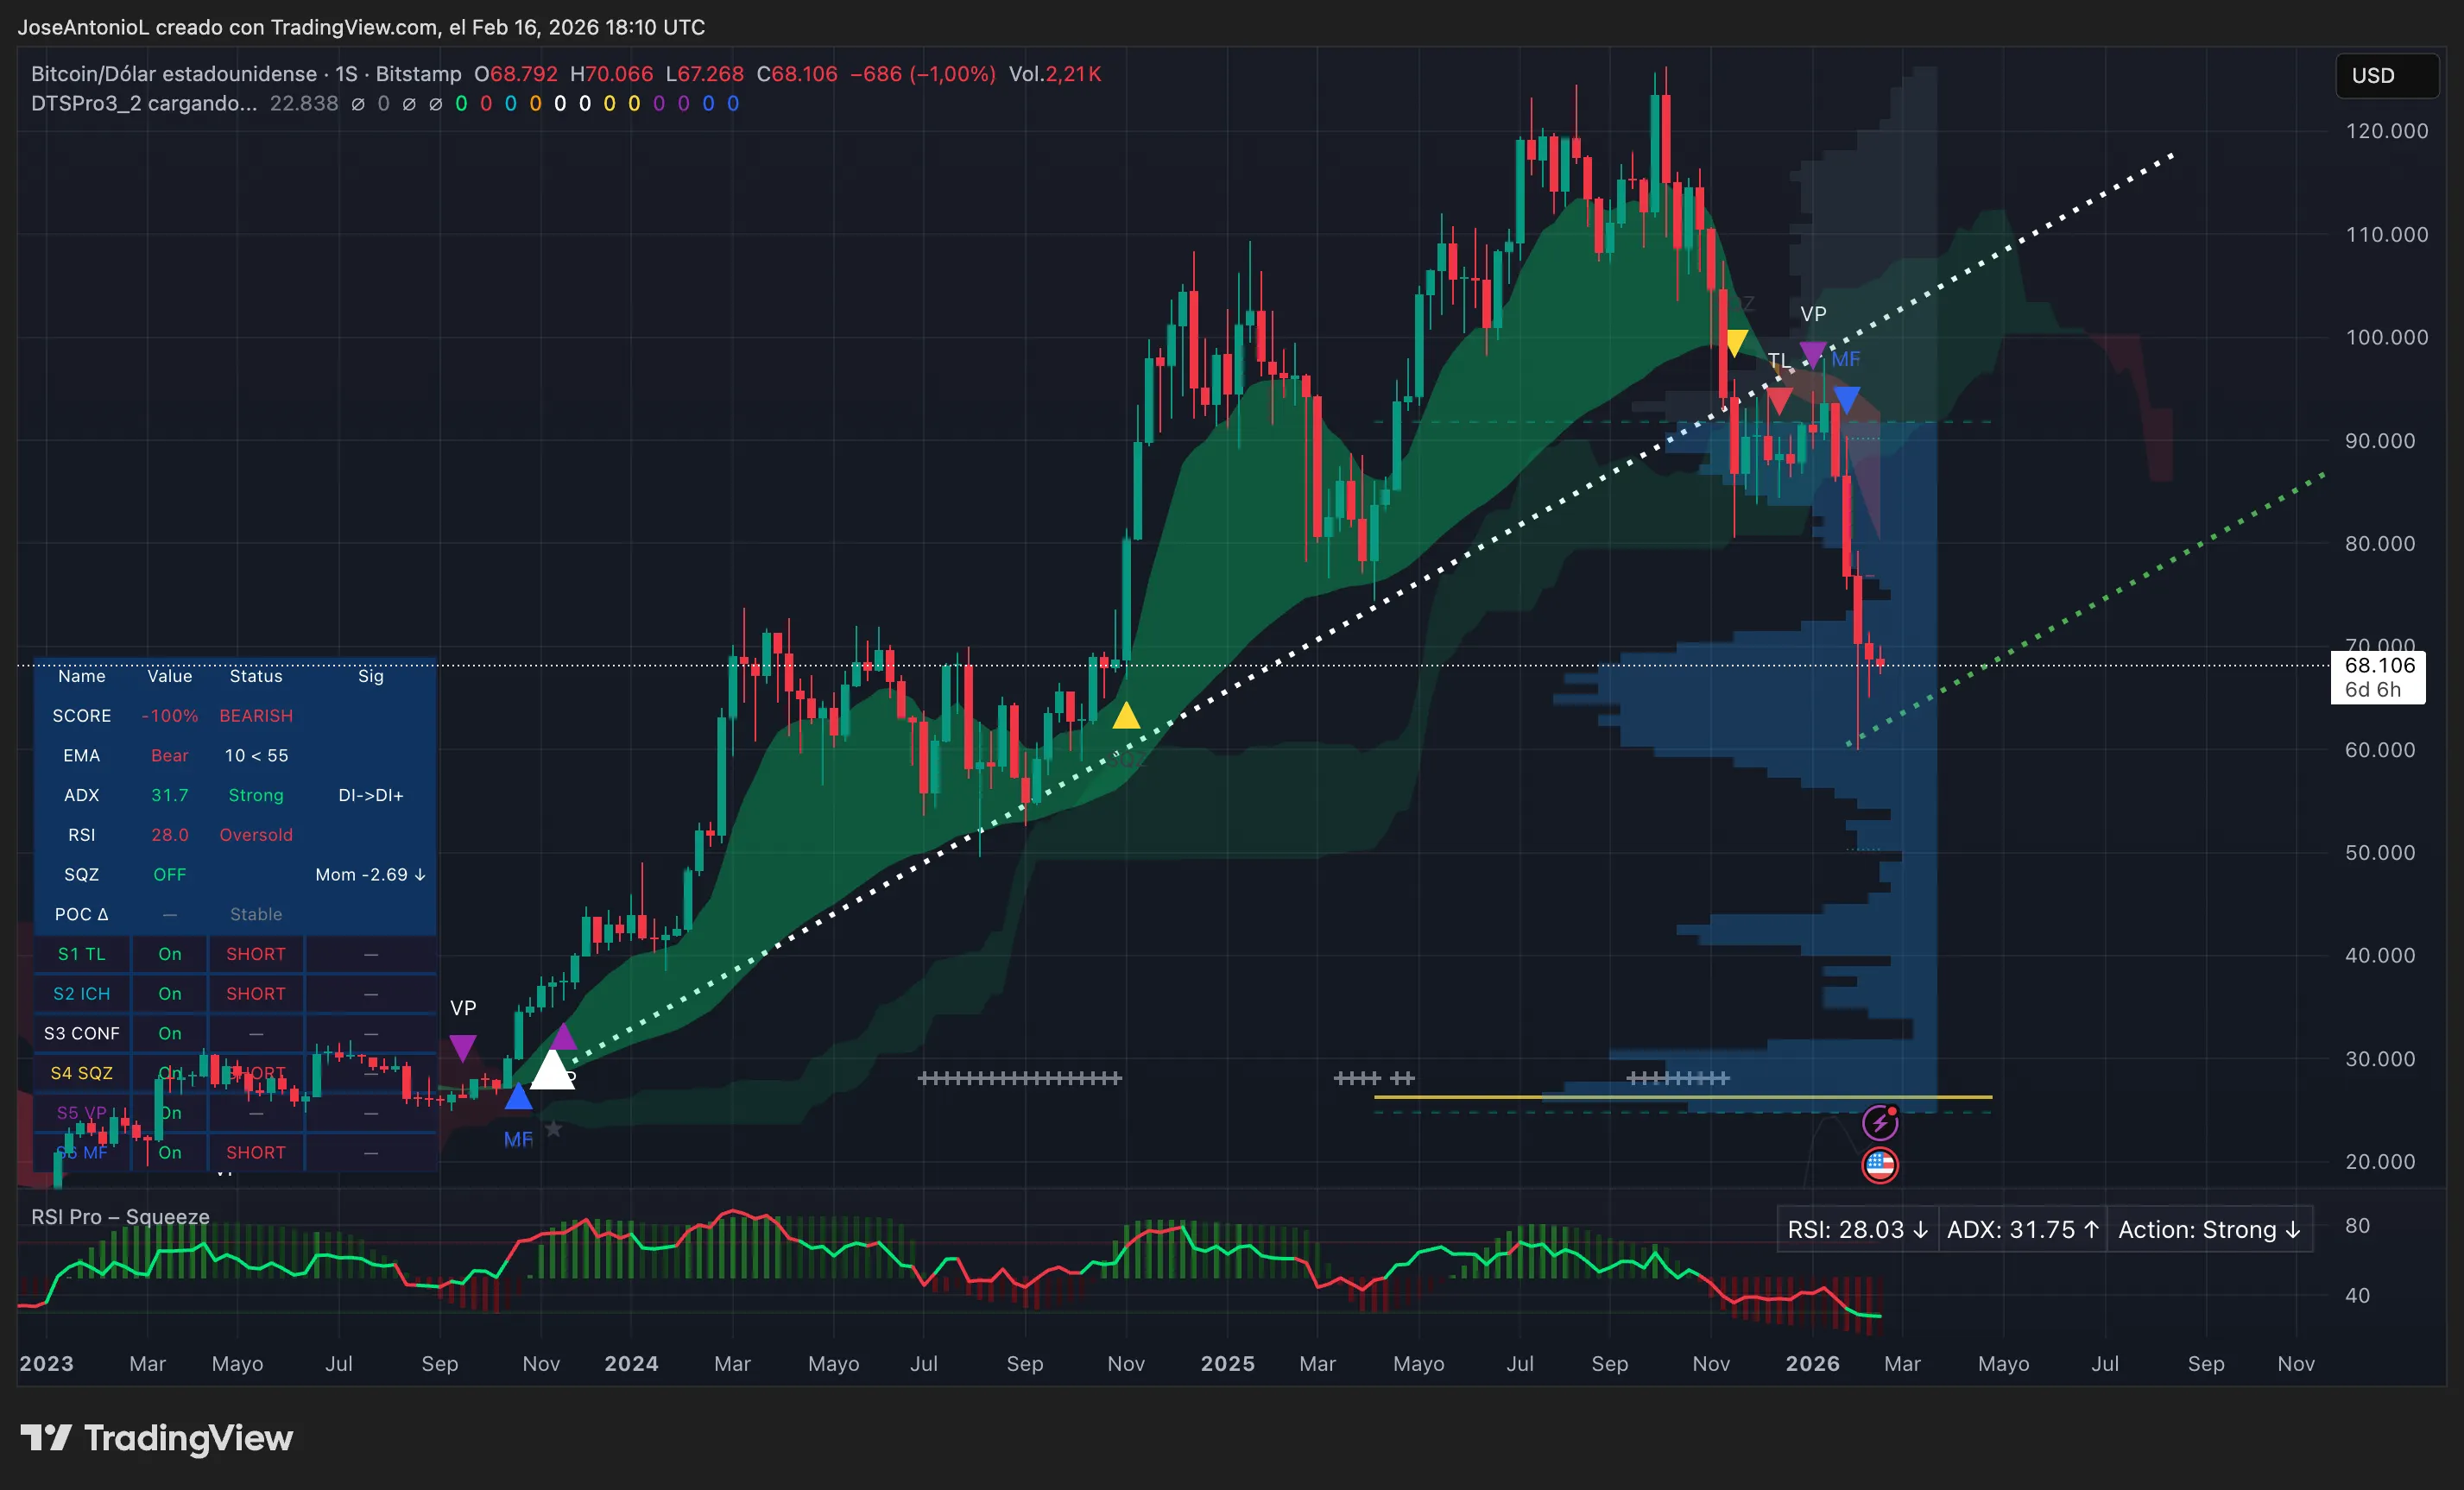
For traders to start talking about a bullish move, Bitcoin price would need to show at least one of two unlikely scenarios: Either a massive rally past the $100,000 mark to resume the 2024-2025 trend, or a consistent series of candlesticks with higher lows respecting at least support similar to that shown in the dotted green line below (extension of previous trend).
For now, Bitcoin remains trapped in one of the most persistent downtrends in its history. And with February only two weeks away, time is running out to avoid this fifth consecutive red month.
Disclaimer
The views and opinions expressed by the author are for informational purposes only and do not constitute financial, investment or other advice.
Daily debriefing Newsletter
Start each day with the biggest news stories of the day, plus original features, a podcast, videos and more.