


Join our Telegram channel to stay up to date with the latest news
The price of Bitcoin fell 1% over the past 24 hours to trade at $121,453 as of 4 a.m. ET, a 27% drop in trading volume to $59.41 billion.
This comes after trader Peter Brandt told his 810,000 followers on
But he also warned that the cycle top could be near and a reversal could follow if Bitcoin fails to break its usual cycle pattern this week.
Veteran trader Peter Brandt just dropped a bombshell:
If $BTC won’t plateau anytime soon, we’re heading towards moving well beyond $150,000, maybe even $185,000.
Cycles don’t lie…and this one is three for three.
Don’t erase history.#BTC #CryptoTrading #Crypto #Bullish pic.twitter.com/8CO4NJSwrS
– SushiBrain🍣🔺 (@SushiBrain_ETH) October 9, 2025
Brandt outlined his theory by examining the structure of Bitcoin’s four-year cycle. In previous cycles, the time between the trough and the halving generally corresponded to the time between the halving and the price peak. For this cycle, the low occurred in November 2022, 533 days before the April 2024 halving.
The addition of another 533 days pointed to early October 2025, just as Bitcoin hit a new all-time high of over $126,000. “If Bitcoin breaks the cycle top, the moves that follow can be explosive,” Brandt said, suggesting $185,000 is possible, perhaps even higher.
Other analysts are watching closely. Rekt Capital predicts that if cycles follow past trends, the market peak could arrive this month.
Economist Timothy Peterson gave Bitcoin a 50% chance of closing October above $140,000, while more optimistic voices like Arthur Hayes and Joe Burnett project it to get closer to $250,000 before the end of 2025.
Bitcoin is entering the thrill zone of the four-year cycle.
History says we could exceed $200,000 in 2025.
—I use a power curve fit of the historical Bitcoin price in USD to capture the long term trend. Then I measure price deviation from this trend using the “years…” metric. pic.twitter.com/fkZZRPI4Eh
-apsk32 (@apsk32) September 13, 2025
As Brandt reminds traders, cycles eventually change, so it pays to remain vigilant in case the market defies expectations.
Bitcoin Price Rise Fueled by Big Money and On-Chain Trends
On-chain metrics confirm this bullish setup. Blockchain data indicates a sharp decline in exchange balances. Buyers are moving coins from exchanges to private wallets, indicating fewer immediate sellers and more long-term holders.
The number of active addresses and the number of transactions have also increased, demonstrating real user engagement and network demand. Analysts say the supply squeeze is intensifying, with long-term holders absorbing excess coins while short-term traders exit.
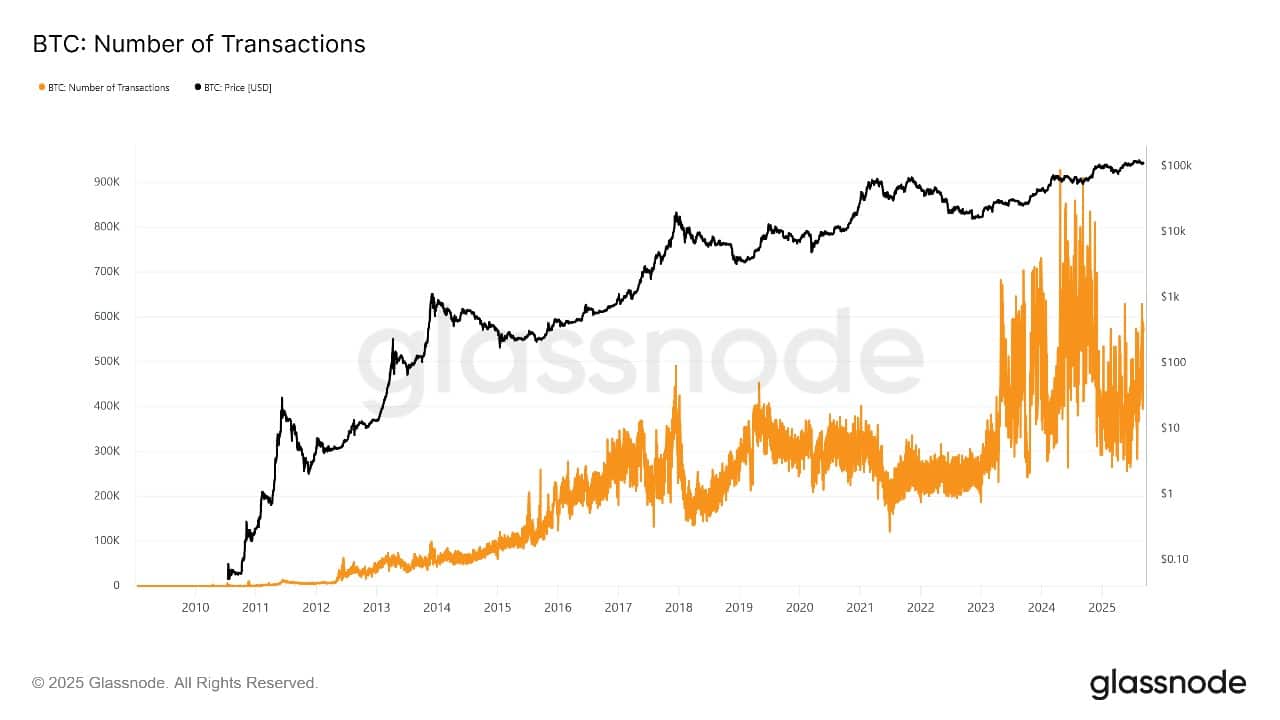
BTC Number of active addresses Source: Glassnode
After peaking in August, Bitcoin price entered a period of healthy correction and consolidation in September. This phase helped eliminate short-term speculation and move coins into the hands of committed investors, establishing a stronger foundation for the next big move.
The October rally triggered massive liquidations of bearish positions, with $330 million in short sales forced to buy back higher. This short squeeze fueled the explosive breakout, helping to solidify Bitcoin’s new higher trading range.
ETF flows remain a key driver for coin pricing. As assets under management increase, experts believe that institutional adoption will maintain upward pressure on the price of Bitcoin. Adoption of Treasury by businesses and even sovereign entities is expected to provide additional support in the coming months.
Bitcoin Price Prediction: Bulls are in control but some risks remain
Looking at technical analysis, Bitcoin remains in a solid uptrend. The weekly chart shows that the price is trading firmly above the 50-week SMA ($101,120) and the 200-week SMA ($53,830), which are considered major support levels by traders.
The current price sits around $121,457, sitting above a crucial zone that buyers have been consistently stepping into.
Two key support areas are marked on the chart: just above $118,000 and near the $101,000 level (the 50-week SMA). These levels have caused Bitcoin to reliably rebound from declines in recent weeks, indicating strong market confidence. As long as BTC remains above these points, the uptrend remains intact.
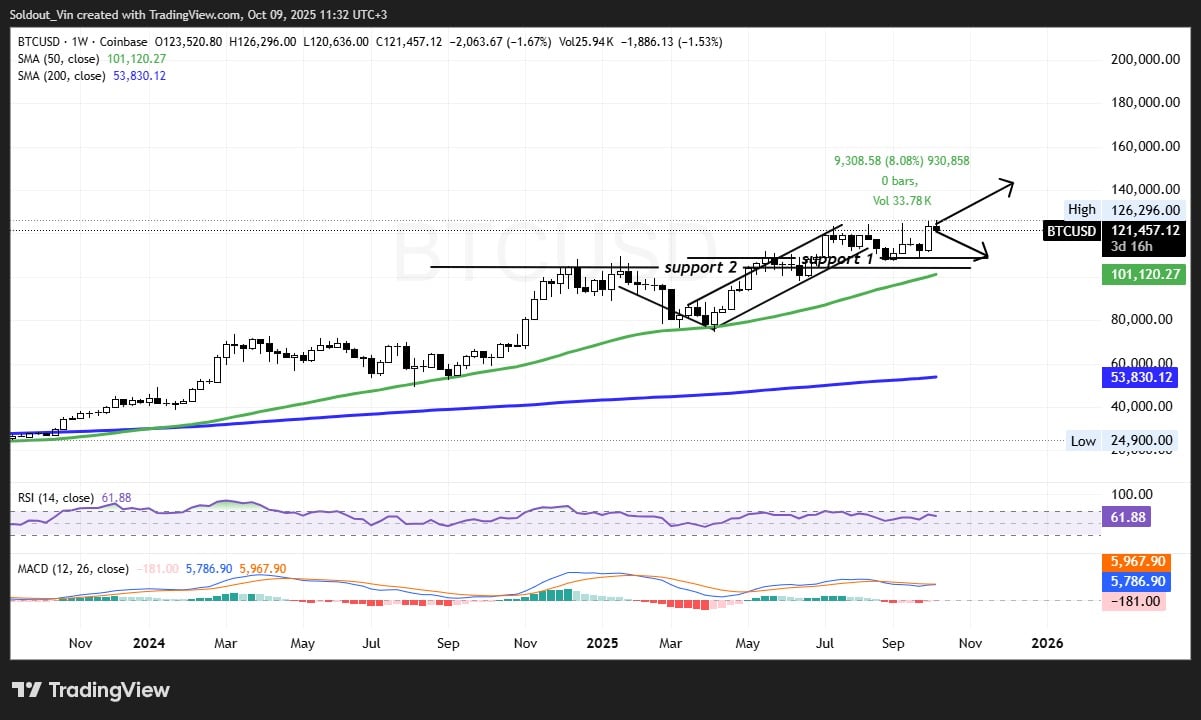
BTCUSD analysis source: Tradingview
The relative strength index (RSI) stands at 61.88, suggesting healthy but not overheated buying activity. This leaves more room for additional gains before a major correction risk sets in.
The MACD indicator is also bullish, with the blue MACD line above the orange signal line, reflecting strong buyer momentum. Trading volumes have soared, confirming investor interest at these critical price levels.
Currently, resistance lies near $126,000 (the previous high) and then at $135,000, where technical analysis suggests sellers may emerge. If Bitcoin breaks above $126,000 and remains stable, the next move could easily target $140,000 and then the ambitious $185,000 level if Brandt’s “cycle break” theory comes true.
Above $140,000, price discovery could accelerate, fueled by ETF inflows and supply squeeze dynamics.
However, if Bitcoin stalls or pulls back this week, traders expect the price to retest support zones below $120,000, or even $101,000, before attempting to rebound again. The risk of a near-term reversal remains if the market views recent highs as the top of the four-year cycle.
Bitcoin’s near-term future will be decided in the coming weeks, either by setting a new long-term high or pausing for a healthy correction.
Related articles:
Best Wallet – Diversify your crypto portfolio

- Easy-to-use, feature-driven crypto wallet
- Get Early Access to Upcoming Token ICOs
- Multi-chain, multi-wallet, non-custodial
- Now on App Store, Google Play
- Stake to win a $BEST native token
- More than 250,000 active users per month
Join our Telegram channel to stay up to date with the latest news