


Join our Telegram channel to stay up to date with the latest news
Bitcoin price fell 2% over the past 24 hours to trade at $101,647 as of 4:05 a.m. EST, with daily trading volume increasing 37% to $110.41 billion.
The correction follows heavy selling pressure as US Bitcoin and Ethereum spot ETFs saw outflows of almost $800 million yesterday. Concerns are growing in the crypto market over weaker demand, bearish institutional signals, and what happens next for the BTC price.
Significant losses began earlier this week when Bitcoin broke key $100,000 support. The sharp drop triggered a wave of concern, sparking extreme fear among traders and analysts.
According to CryptoQuant, if the $100,000 level does not hold, Bitcoin could fall much lower, even falling to $72,000 in the coming months.
For several days in a row, funds like BlackRock’s IBIT experienced huge drawdowns, pulling liquidity from the Bitcoin market just as other signals were turning negative.
Demand for Bitcoin cash is falling off a cliff.
One of the main reasons we see this dump. pic.twitter.com/B4TPipd9sB
– Crypto Rover (@cryptorover) November 5, 2025
When ETF flows are positive, they generally help Bitcoin by reducing the available supply, but when they turn negative, they have the opposite effect.
On-Chain Trends for Bitcoin Signal Declining Demand
Research from CryptoQuant indicates a steady decline in spot demand since a massive liquidation event hit the market on October 11. On that day, over $19 billion in leveraged positions were wiped out, marking the largest single liquidation in crypto history. Since then, indicators such as spot exchange flows, ETF flows, and Coinbase premium have been mostly negative.
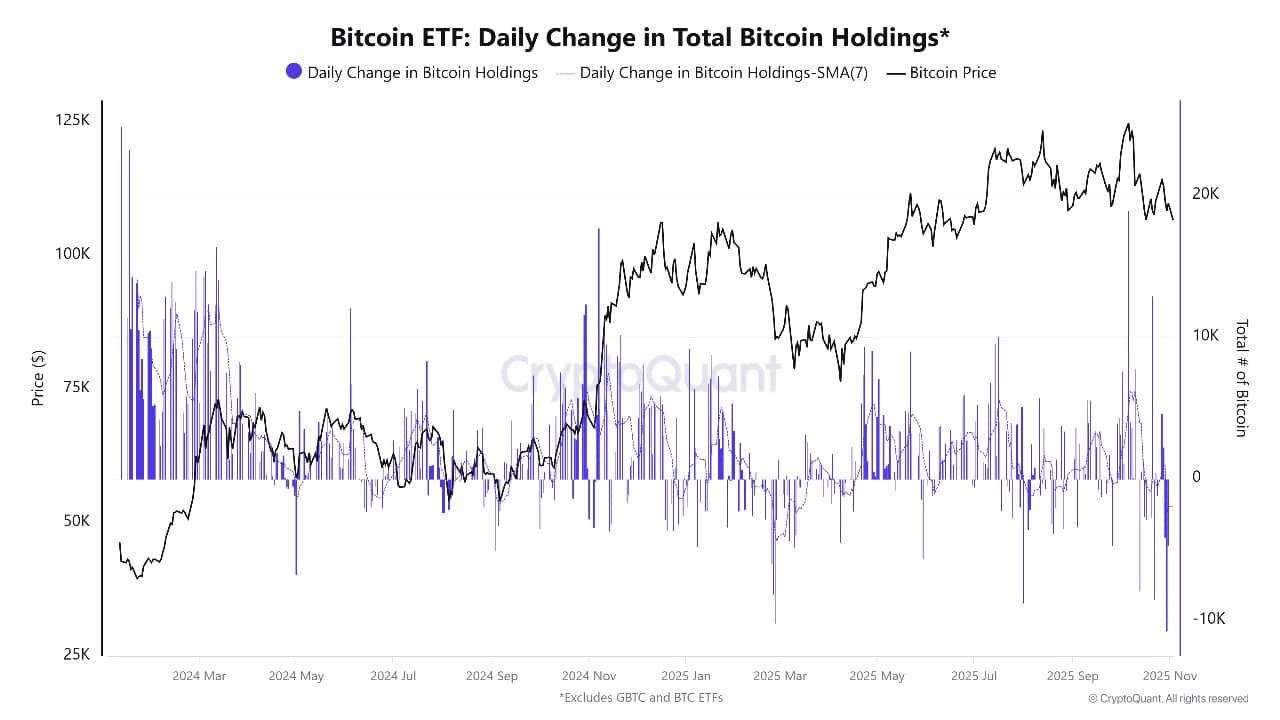
Daily change in total Bitcoin holdings Source: CryptoQuant
The Bull Score index, which tracks sentiment and momentum, has fallen to 20. This low score signals a clear bear market. Falling demand from US investors and Coinbase’s negative premium show that US buyers are now more hesitant or selling more than they buy.
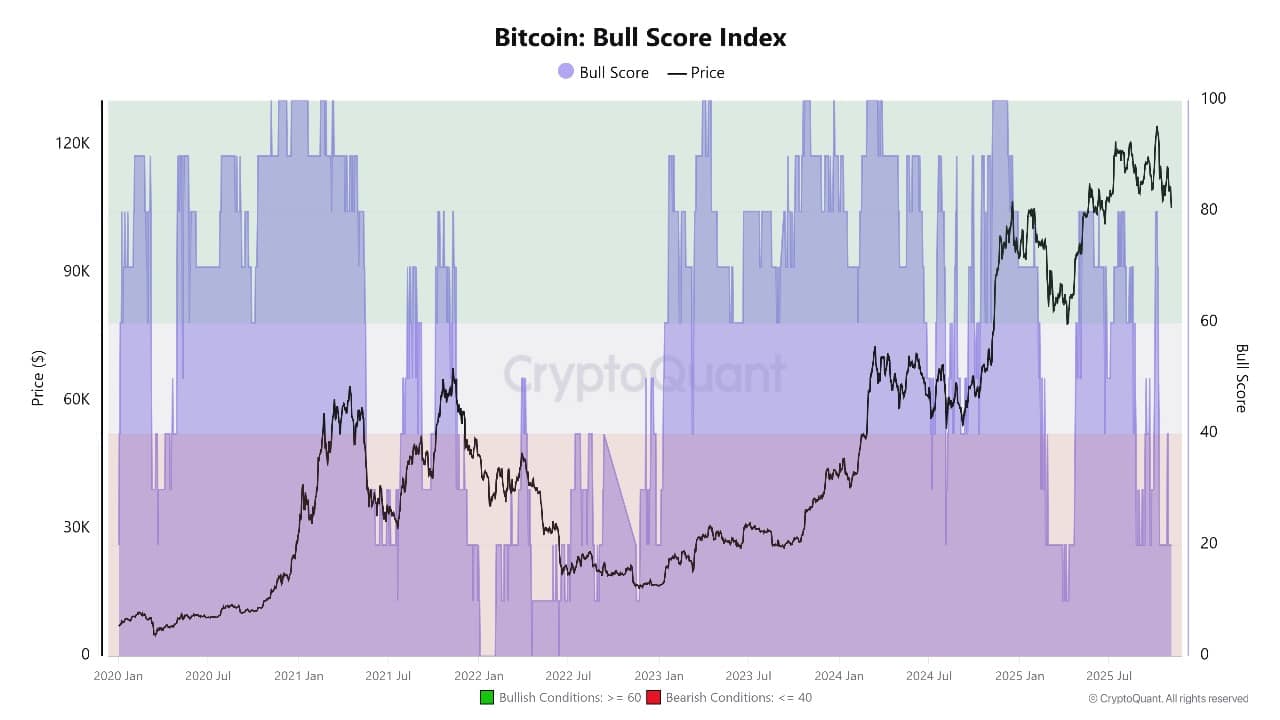
Bitcoin Bull Score Index Source: CryptoQuant
Additionally, historical parallels are drawn to previous bear market periods, when Bitcoin spot demand weakened and price corrections became widespread. With ETF outflows increasing and trading activity on exchanges declining, confidence in a rapid rebound remains very low among analysts who monitor blockchain data.
Bitcoin Price Prediction: Could BTC Drop to $72,000?
The technical situation for Bitcoin is becoming more and more bearish. According to CryptoQuant and analysts like Julio Moreno, the most important level to watch is $100,000. If Bitcoin trades below this for an extended period, the risk of a drop to $72,000 increases sharply over the next one or two months.
On the weekly chart, Bitcoin is still in a wide ascending channel, but recent candles look heavy and sellers are pushing the price towards the middle of the range. The $102,940 level matches Bitcoin’s 50-week simple moving average (SMA), which previously served as support but could now become resistance.
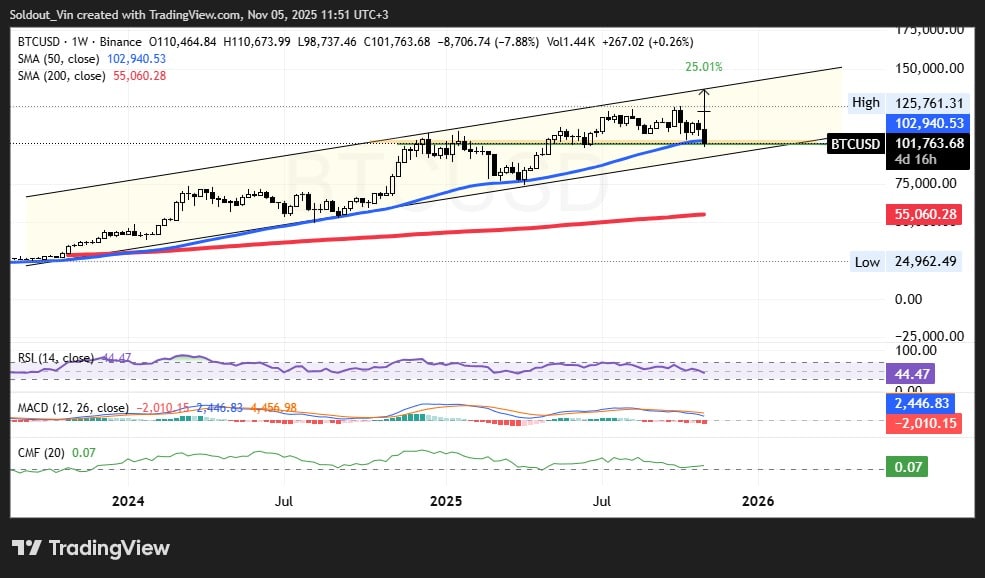
BTCUSD analysis source: Tradingview
If BTC fails to recover and hold above this line in the near future, further declines could occur.
Meanwhile, momentum indicators point to increasing weakness: the RSI (Relative Strength Index) is hovering around 44, a bearish reading that suggests the bears are in charge and there is room for continued decline.
The MACD (Moving Average Convergence Divergence) has moved negative, supporting the idea that a deeper downtrend is forming. While the CMF (Chaikin Money Flow) is barely above zero, reflecting minimal capital inflow.
If the selling pressure persists and Bitcoin cannot create new support above $100,000, the lower boundary of the channel, currently near $75,000, will likely be tested next. This aligns with CryptoQuant’s warning of a potential decline to $72,000. Historical support around $80,000 to $85,000 may offer only brief relief if panic selling takes hold.
On the positive side, if Bitcoin recovers quickly and recovers between $103,000 and $105,000, it could start to stabilize. Key resistance lies at $110,000 and then again at $125,000, where many traders will be watching to see if the bulls can come back strong. Still, with ETF outflows and on-chain weakness dominating headlines, sentiment remains cautious for now.
Related articles:
Best Wallet – Diversify your crypto portfolio

- Easy-to-use, feature-driven crypto wallet
- Get Early Access to Upcoming Token ICOs
- Multi-chain, multi-wallet, non-custodial
- Now on App Store, Google Play
- Stake to win a $BEST native token
- More than 250,000 active users per month
Join our Telegram channel to stay up to date with the latest news