


Join our Telegram channel to stay up to date with the latest news
The price of Bitcoin fell 4% in October, breaking its seven-year streak as ETF outflows, profit-taking and macroeconomic jitters weighed on the market.
An analysis by Fortune showed that this was Bitcoin’s fourth worst performance in October since 2013 and the worst in the last seven years. This left BTC lagging the S&P 500 stock index, which rose 2.3%.
The sell-off came as more than $550 million was withdrawn from major Bitcoin and Ethereum ETFs at the end of the month, with analysts saying profit-taking also played a role as Bitcoin cash companies, including Michael Saylor’s strategy, also slowed their BTC purchases.
We have just experienced the first red October in 7 years!
We also had a historic liquidation in October!
UPTOBER was a fraud, but MOONVEMBER??
In my humble opinion;
if you can, DCA more!
if you can’t, DON’T panic, sell your bags cheap!
If you are out of $$ and are sure of your port,… pic.twitter.com/LH7aYTwQeY
-Blockchain Bob (@blockchainbob) October 31, 2025
Even a year-long trade truce between US President Donald Trump and China’s Xi Jinping last week was not enough to bring Bitcoin back into the green for the month.
Trump’s October 10 announcement that he would impose additional 100% tariffs on Chinese exports triggered more than $19 billion in liquidations in 24 hours, the largest ever in the crypto market.
One reason sentiment has remained pessimistic after the U.S.-China trade truce is Federal Reserve Chairman Jerome Powell’s comment this week that another interest rate cut in December is far from certain.
$BTC Calm is the signal
The price moves less, the conviction moves more.
FX supply hits cycle low as long-term holders tighten their grip on quietly dwindling liquidity.
ETFs continue to absorb without making headlines, mining difficulties increase and volatility compresses.
This is not… pic.twitter.com/7ylx3uoCW7
– Senior 🛡🦇🔊 (@SeniorDeFi) October 31, 2025
On-Chain Bitcoin Signals Show Resilience
Despite the coin price decline, on-chain data indicates the continued strength of the Bitcoin network. Exchange reserves Bitcoin hit its all-time low in October, falling by more than 200,000 BTC in just one month. This means fewer coins are held on exchanges where they can easily be sold.
A sign that investors are moving the coins into their portfolio and perhaps planning to hold them for the long term.
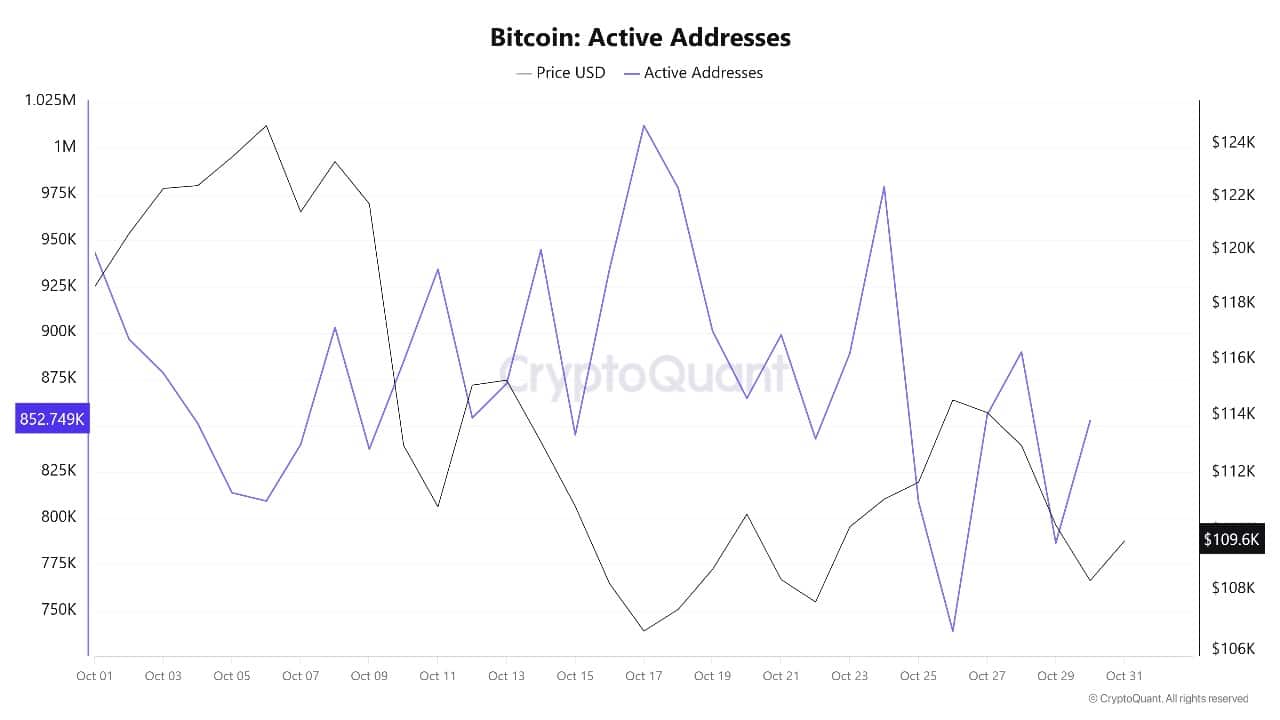
The supply of BTC on trading platforms is decreasing, making the coin more scarce and potentially paving the way for a future rally. This pullback pattern is similar to what occurred before Bitcoin’s surge in 2020 and reflects a strong belief in the long-term value of Bitcoin.
Institutional accumulation continues even with ETF exits, as some large players move coins into private custody. Bitcoin’s network activity, including active addresses And transaction account, remained strong, showing that people are using the network even during a month of falling prices.
Bitcoin Price Prediction
Looking at the weekly price chart, Bitcoin is currently trading at $109,496.77after pulling back from the October high but remaining well above important support levels. The price is above the 50-week simple moving average (SMA) at $102,843.54, while the long-term 200-week SMA is much lower at $54,756.36.
These SMA levels provide strong support for Bitcoin price and help limit further losses. The chart shows that Bitcoin is moving in an upward trending channel, with resistance near $125,761 and falling support around $102,843. The uptrend remains in play as long as price remains above the lower support line and key moving averages.
Technical indicators indicate a pause in the bullish momentum: the Relative Strength Index (RSI) sits at 50.32, right in the middle, suggesting that neither buyers nor sellers are clearly in control and the market is consolidating.
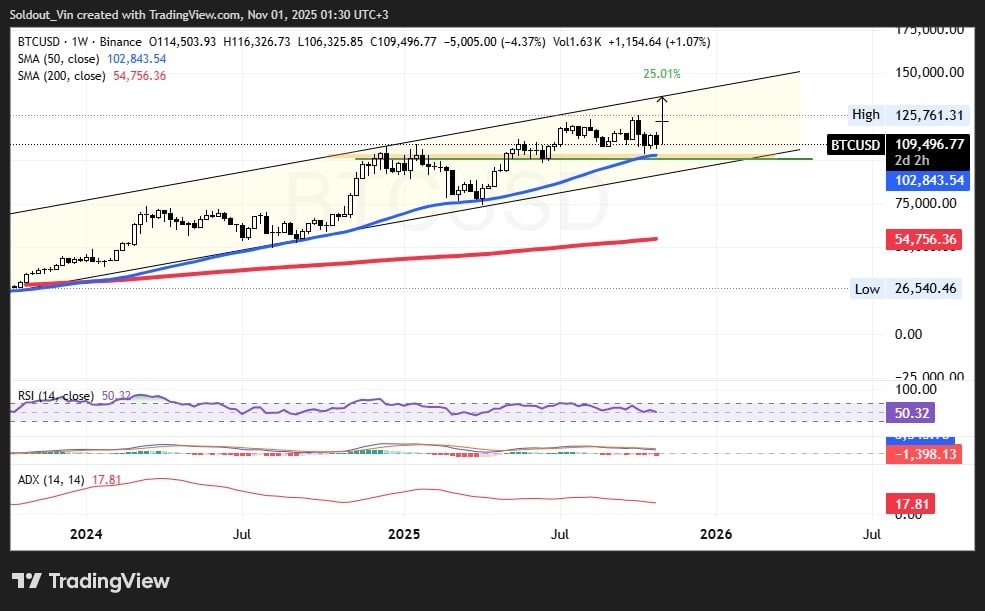
BTCUSD analysis source: Tradingview
The Average Directional Index (ADX) is reading 17.81, showing that the current trend is weak and further momentum is needed to start another rally. If buyers return and break above resistance at $125,761, Bitcoin could attempt to regain its highs. However, if the price falls below the 50-week SMA ($102,843), further selling could push it towards the next major support at $54,756.
The MACD (Moving Average Convergence Divergence) indicator remains in neutral territory, suggesting a sideways movement for now. Low trading volume and lack of strong momentum mean Bitcoin could trade in a tight range over the coming weeks.
If the coin price rebounds from the support at $102,843, a further attempt at resistance at $125,761 could attract more buyers. But a break below support could see Bitcoin test deeper levels before bulls intervene again.
In November, much will depend on global financial trends and the return of new institutional funds to the market. If macroeconomic risks stabilize and ETF flows become positive again, the coin price could resume its rise and prepare for another rally.
However, prices could consolidate as both bulls and bears wait for the next big move. Traders should monitor support at $102,843 and resistance at $125,761, as breaks beyond these levels could signal Bitcoin’s next price direction.
Related articles:
Best Wallet – Diversify your crypto portfolio

- Easy-to-use, feature-driven crypto wallet
- Get Early Access to Upcoming Token ICOs
- Multi-chain, multi-wallet, non-custodial
- Now on App Store, Google Play
- Stake to win a $BEST native token
- More than 250,000 active users per month
Join our Telegram channel to stay up to date with the latest news