


Join our Telegram channel to stay up to date with the latest news
Bitcoin’s price fell 1% over the past 24 hours to trade at $92,024.99 as of 3:55 a.m. EST on trading volume that fell 20% to $57.59 billion.
The drop came as BlackRock CEO Larry Fink said several sovereign wealth funds were buying the dip during Bitcoin’s recent sharp correction.
Larry Fink casually confirming that sovereign wealth funds bought Bitcoin’s recent drop to 80K might be the most underrated story of the year.
When “selling the dip” becomes “you sold it to a country”. pic.twitter.com/eHPjeAm6Kk
-ElonTrades (@ElonTrades) December 5, 2025
“They’re gradually adding to $120,000, $100,000…I know they bought more in the ’80s,” he said.
Fink said the funds are long-term holders and present Bitcoin as a strategic asset that can help sovereign investors protect against currency depreciation, fiscal uncertainty and global economic instability.
This model corresponds to a broader trend: digital assets are no longer niche securities for individuals or small investors. Large institutions are starting to consider BTC as part of traditional wallets.
If accumulation continues, it could reduce the likelihood of sharp declines and support a more stable price floor over time.
The move by institutional buyers also indicates that while the price of Bitcoin may wobble in the short term, the long-term narrative remains strong.
Bitcoin price eyes a breakout towards $100,000
BTCUSDT price action indicates a pullback from the upper boundary of a multi-month ascending channel. The price decline towards the lower boundary of the channel, around the $90,000-$91,000 zone, could serve as a springboard.
If BTC finds support here and rebounds, the trajectory towards $100,000 seems plausible. A breakout could target the upper wall of the channel near $126,000. The level from which BTC started this correction.
However, this bullish scenario depends on whether buyers intervene near the lower boundary of the channel and whether sovereign wealth accumulation continues. If lower support breaks, Bitcoin could test even lower levels, possibly revisiting the intermediate channel or recent lows.
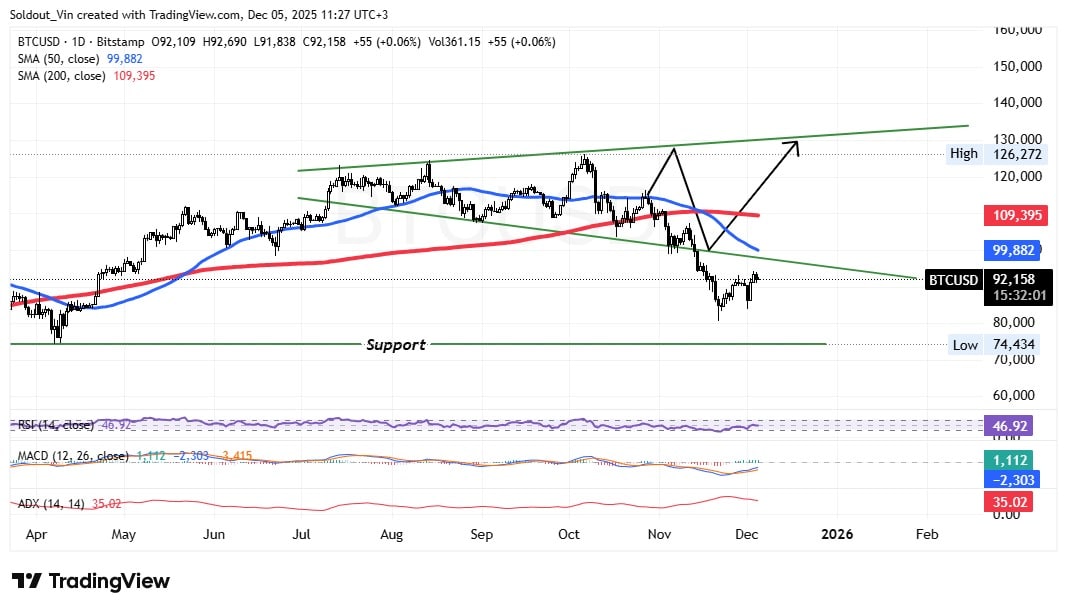
BTCUSD analysis source: Tradingview
The Relative Strength Index (RSI) is currently at 46.92, indicating a neutral reading. Sellers still have a slight edge, but the fact that it is slowly increasing suggests that momentum could shift back to buyers if price continues to hold above support.
The MACD line is currently below the signal line, with the histogram still in negative territory. This indicates that the bearish momentum remains present. However, the histogram bars are getting shorter, meaning the selling pressure is weakening. If the MACD moves back above the signal line, it could confirm a bullish reversal from the recent low.
ADX is at 35.02, which signals a strong trend. Since the price has been moving lower, this high ADX reading means that the previous downtrend was strong. If the ADX starts to decline from this level, it would show that the downtrend is losing strength and the market is preparing for a possible trend change or consolidation phase.
Indicators suggest that Bitcoin is stabilizing, bearish momentum is fading, and buyers may start to step in. But confirmation will depend on the MACD reversing and the RSI decisively pushing above 50.
Related articles:
Best Wallet – Diversify your crypto portfolio

- Easy-to-use, feature-driven crypto wallet
- Get Early Access to Upcoming Token ICOs
- Multi-chain, multi-wallet, non-custodial
- Now on App Store, Google Play
- Stake to win a $BEST native token
- More than 250,000 active users per month
Join our Telegram channel to stay up to date with the latest news