


Bitcoin price is trading near $71,000, down 0.5% in the past 24 hours, as the two-week ceasefire between the United States and Iran that led to Tuesday’s broad crypto rally began showing significant signs of unraveling less than 48 hours after it was announced.
The analytical question is no longer whether trade aid can expand – but how much Tuesday’s gains will narrow if the ceasefire fails the first weekend’s stress test, and where the credible floor lies.
DISCOVER: Coin Supercycle: Top Performers This Week
The Re-Premium of Hormuz: how doubt about the ceasefire is transmitted to cryptography
The transmission mechanism here is direct. Iranian Parliament Speaker Mohammad Bagher Ghalibaf said Thursday that three clauses of the ceasefire proposal had been violated – without specifying which ones – while Israeli military operations continued in Lebanon and the Strait of Hormuz, supposed to reopen under the deal, remained effectively closed with minimal tanker traffic.
— محمدباقر قالیباف | MB Ghalibaf (@mb_ghalibaf) April 8, 2026
This last point is the crucial point: the reopening of Hormuz was the centerpiece of the deal, and its failure to materialize means that the energy risk premium that the market had briefly priced in on Tuesday is being reassessed.
Brent crude rebounded +2% to around $97 a barrel after crashing more than 10% in a single day on Wednesday – its worst daily decline in six years. This reversal reflects a market that went from pricing peace to pricing uncertainty in a single trading session.
S&P 500 futures pointed to a 0.2% decline on Thursday, signaling the end of a four-day winning streak for global stocks. The MSCI Asia-Pacific index fell 0.9%, with two stocks down for every stock up, erasing some of the rise caused by Wednesday’s ceasefire.
Treasuries held steady after an earlier rally faded on concerns that rising oil prices would feed through to inflation expectations, bringing the second layer of transmission into play.
The Federal Reserve continued to signal rising inflation risks alongside weakening jobs data, keeping the narrative of higher and longer rates intact. Bitunix analysts characterized the combination as a dual shock from the global energy price overhaul and policy constraints from the Federal Reserve, noting that officials face a difficult balancing act between energy-driven inflation and weakening employment conditions.
DISCOVER: Bitcoin’s $70,000 bottom under pressure from Iranian tensions and macro-inflation
Bitcoin Price: The $70,582 Bottom and $71,766 Resistance That Rejected the Price
Bitcoin’s technical structure remains constrained by the $65,000-$73,000 range that has contained all significant movement since late February, but the asset is now testing the upper half of that range rather than heading lower – which, in the circumstances, is the most constructive observation available.
The immediate concern is that BTC faced a technical rejection during the 23.6% Fibonacci retracement at $71,766 and has since fallen below its 7-day moving average at $71,342, with futures open interest falling 4.25% in a single session amid broader deleveraging.
Key support levels to watch: the 50% Fibonacci retracement at $70,582, the 61.8% level at $70,052 and the low at $68,338 – representing the full round-trip scenario if the ceasefire is formally broken.
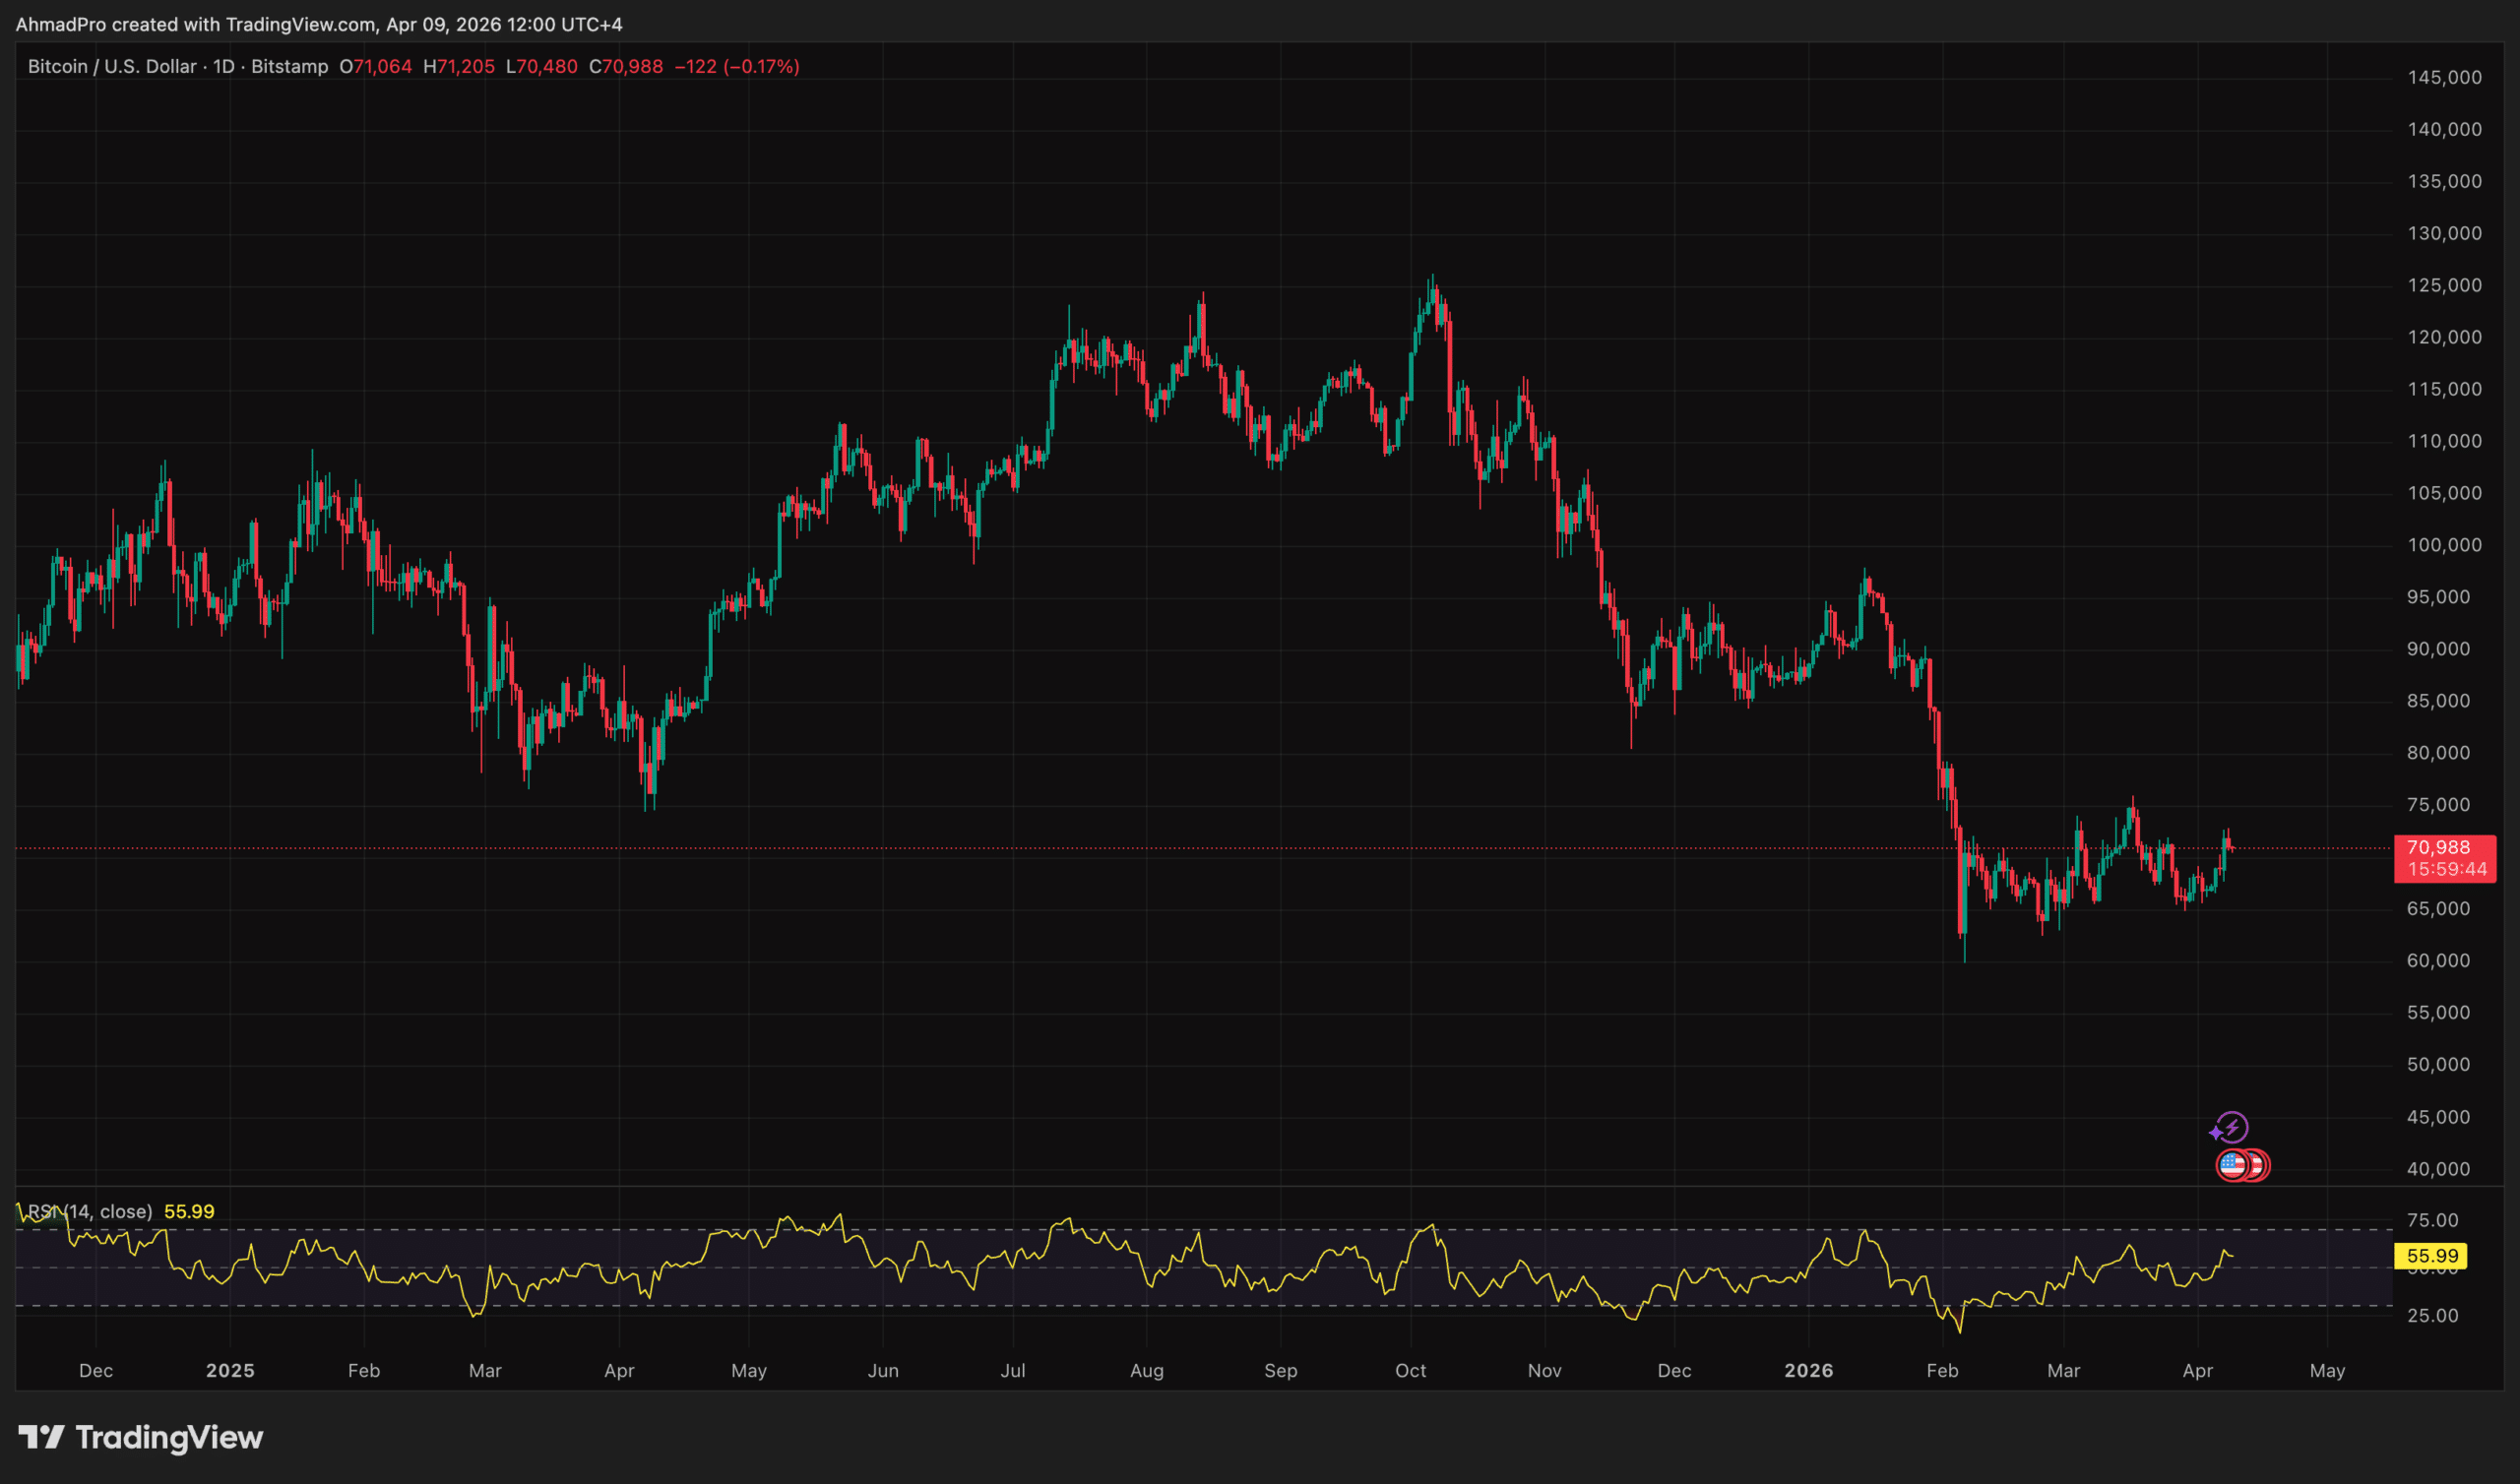
Source: Tradingview
Bitcoin price reached an intraday high of $76,013 earlier in the week before retreating; Thursday’s figure of $70,981 marks a 6.6% decline from that high. The macro range of $65,000 to $73,000 is still intact, but the burden of proof has shifted back to the bullish side.
Right now, Bitcoin is trading straight from geopolitics, not pure technicals, because if the ceasefire actually holds and oil cools, especially with Brent falling below $90, that will take the pressure off the macro side and give BTC the opportunity to reclaim the short-term trend above $71.3k and get back into the $73k-74k area 000 $.
But the market clearly isn’t fully accepting this outcome yet, as the downsides are still very real, and if tensions flare again and oil rises above $100, Bitcoin will likely lose this $70,000 zone and begin to slide towards the $60 highs, with $65,000 back in play as a deeper floor.
So this is one of those times where direction doesn’t just come from the charts, it comes from the headlines, and right now both paths are open, with the market actively pricing in the risk that things could turn negative as quickly as they improve.
EXPLORE: Crypto Breakout Alerts This Week
following
Disclaimer: Coinspeaker is committed to providing unbiased and transparent reporting. This article is intended to provide accurate and current information, but should not be considered financial or investment advice. Because market conditions can change quickly, we encourage you to verify the information for yourself and consult a professional before making any decisions based on this content.

Daniel Frances is a technical writer and Web3 educator specializing in macroeconomics and DeFi mechanics. Hailing from crypto since 2017, Daniel leverages his experience in on-chain analytics to write evidence-based reports and in-depth guides. He holds certifications from the Blockchain Council and is dedicated to providing “insight gain” that overcomes market hype to find real utility for blockchain.