


Bitcoin price is down nearly 29% from its October ATH. Compared to the declines of just over -4% in the S&P and -7% in the Nasdaq, we can easily say that the volatility of BTC is still heavy for traditional investors to bear. Such a decline in indices can be seen during the COVID crash of 2020 and earlier this year, around the tariff wars. Meanwhile, over the past 24 hours, long Bitcoin positions worth +$400 million have been liquidated. Year-over-year Bitcoin ETFs have seen an inflow of $60 billion, and over the last two weeks we’ve seen an outflow of $1.8 billion, which is nothing short of 29%. This should be telling.
And for the record, the last two major corrections in Bitcoin on our road to 126k were higher than the current one in % terms, even with $BTC at 89k.
So any argument for a downtrend that uses the current ~30% pullback as justification for that position is frankly stupid.… pic.twitter.com/YXXkwXknec
– CrediBULL Crypto (@CredibleCrypto) November 18, 2025
A lot of people could be doomed for the Bitcoin world. Some, like CrediBULL, are not. Others like it are the country of El Salvador, which recently purchased for $100 million. For some people, these dips are buying opportunities and for others, a signal to sell. This is what a free market looks like.
DISCOVER: 10+ next cryptos to 100X in 2025
Bitcoin Price Found Weekly FVG – Is This Support?

(Source – Tradingview, BTCUSD)
What if we opened the charts now? Let’s start with the 1W period. Oh, the pain. This is looking like one of the worst Novembers ever. 4 sell weekly candles in a row so far. We are still ahead and the fourth could close higher.
But it’s still not what people expected for this month. We just fell below the 2024 high and the MA50 like a knife through butter – without any support. We entered the svg path .cwp-coin-chart { Stroke-width: 0.65 !important; } .cwp-coin-widget-container .cwp-graph-container.positive svg path: nth-of-type (2) { trait: #008868 !important; } .cwp-coin-widget-container .cwp-coin-trend.positive { color: #008868 !important; background-color: transparent !important; } .cwp-coin-widget-container .cwp-coin-popup-holder .cwp-coin-trend.positive { border: 1px solid #008868; border-radius: 3px; } .cwp-coin-widget-container .cwp-coin-trend.positive::before { border-bottom: 4px solid #008868 !important; } .cwp-coin-widget-container .cwp-coin-price-holder .cwp-coin-trend-holder .cwp-trend { background-color: transparent !important; } .cwp-coin-widget-container .cwp-graph-container.negative svg path: nth-of-type (2) { trait: #A90C0C !important; } .cwp-coin-widget-container .cwp-coin-popup-holder .cwp-coin-trend.negative { border: 1px solid #A90C0C; border-radius: 3px; } .cwp-coin-widget-container .cwp-coin-trend.negative { color: #A90C0C !important; background-color: transparent !important; } .cwp-coin-widget-container .cwp-coin-trend.negative::before { border-top: 4px solid #A90C0C !important; }
![]()
Bitcoin
3.19%
![]()
Bitcoin
BTC
Price
$93,330.06
3.19% /24h
Volume in 24 hours
$94.46 billion
Price 7d
// Make SVG responsive jQuery (document). svg.attr(‘viewBox’, ‘0 0 ‘ + originalWidth + ‘ ‘ + originalHeight); } svg.removeAttr(‘width’).removeAttr(‘height’); } });
LVF deviation. Will this be the support we expected?
DISCOVER: 15+ Upcoming Coinbase Listings to Watch in 2025
(Source – Tradingview, BTCUSD)
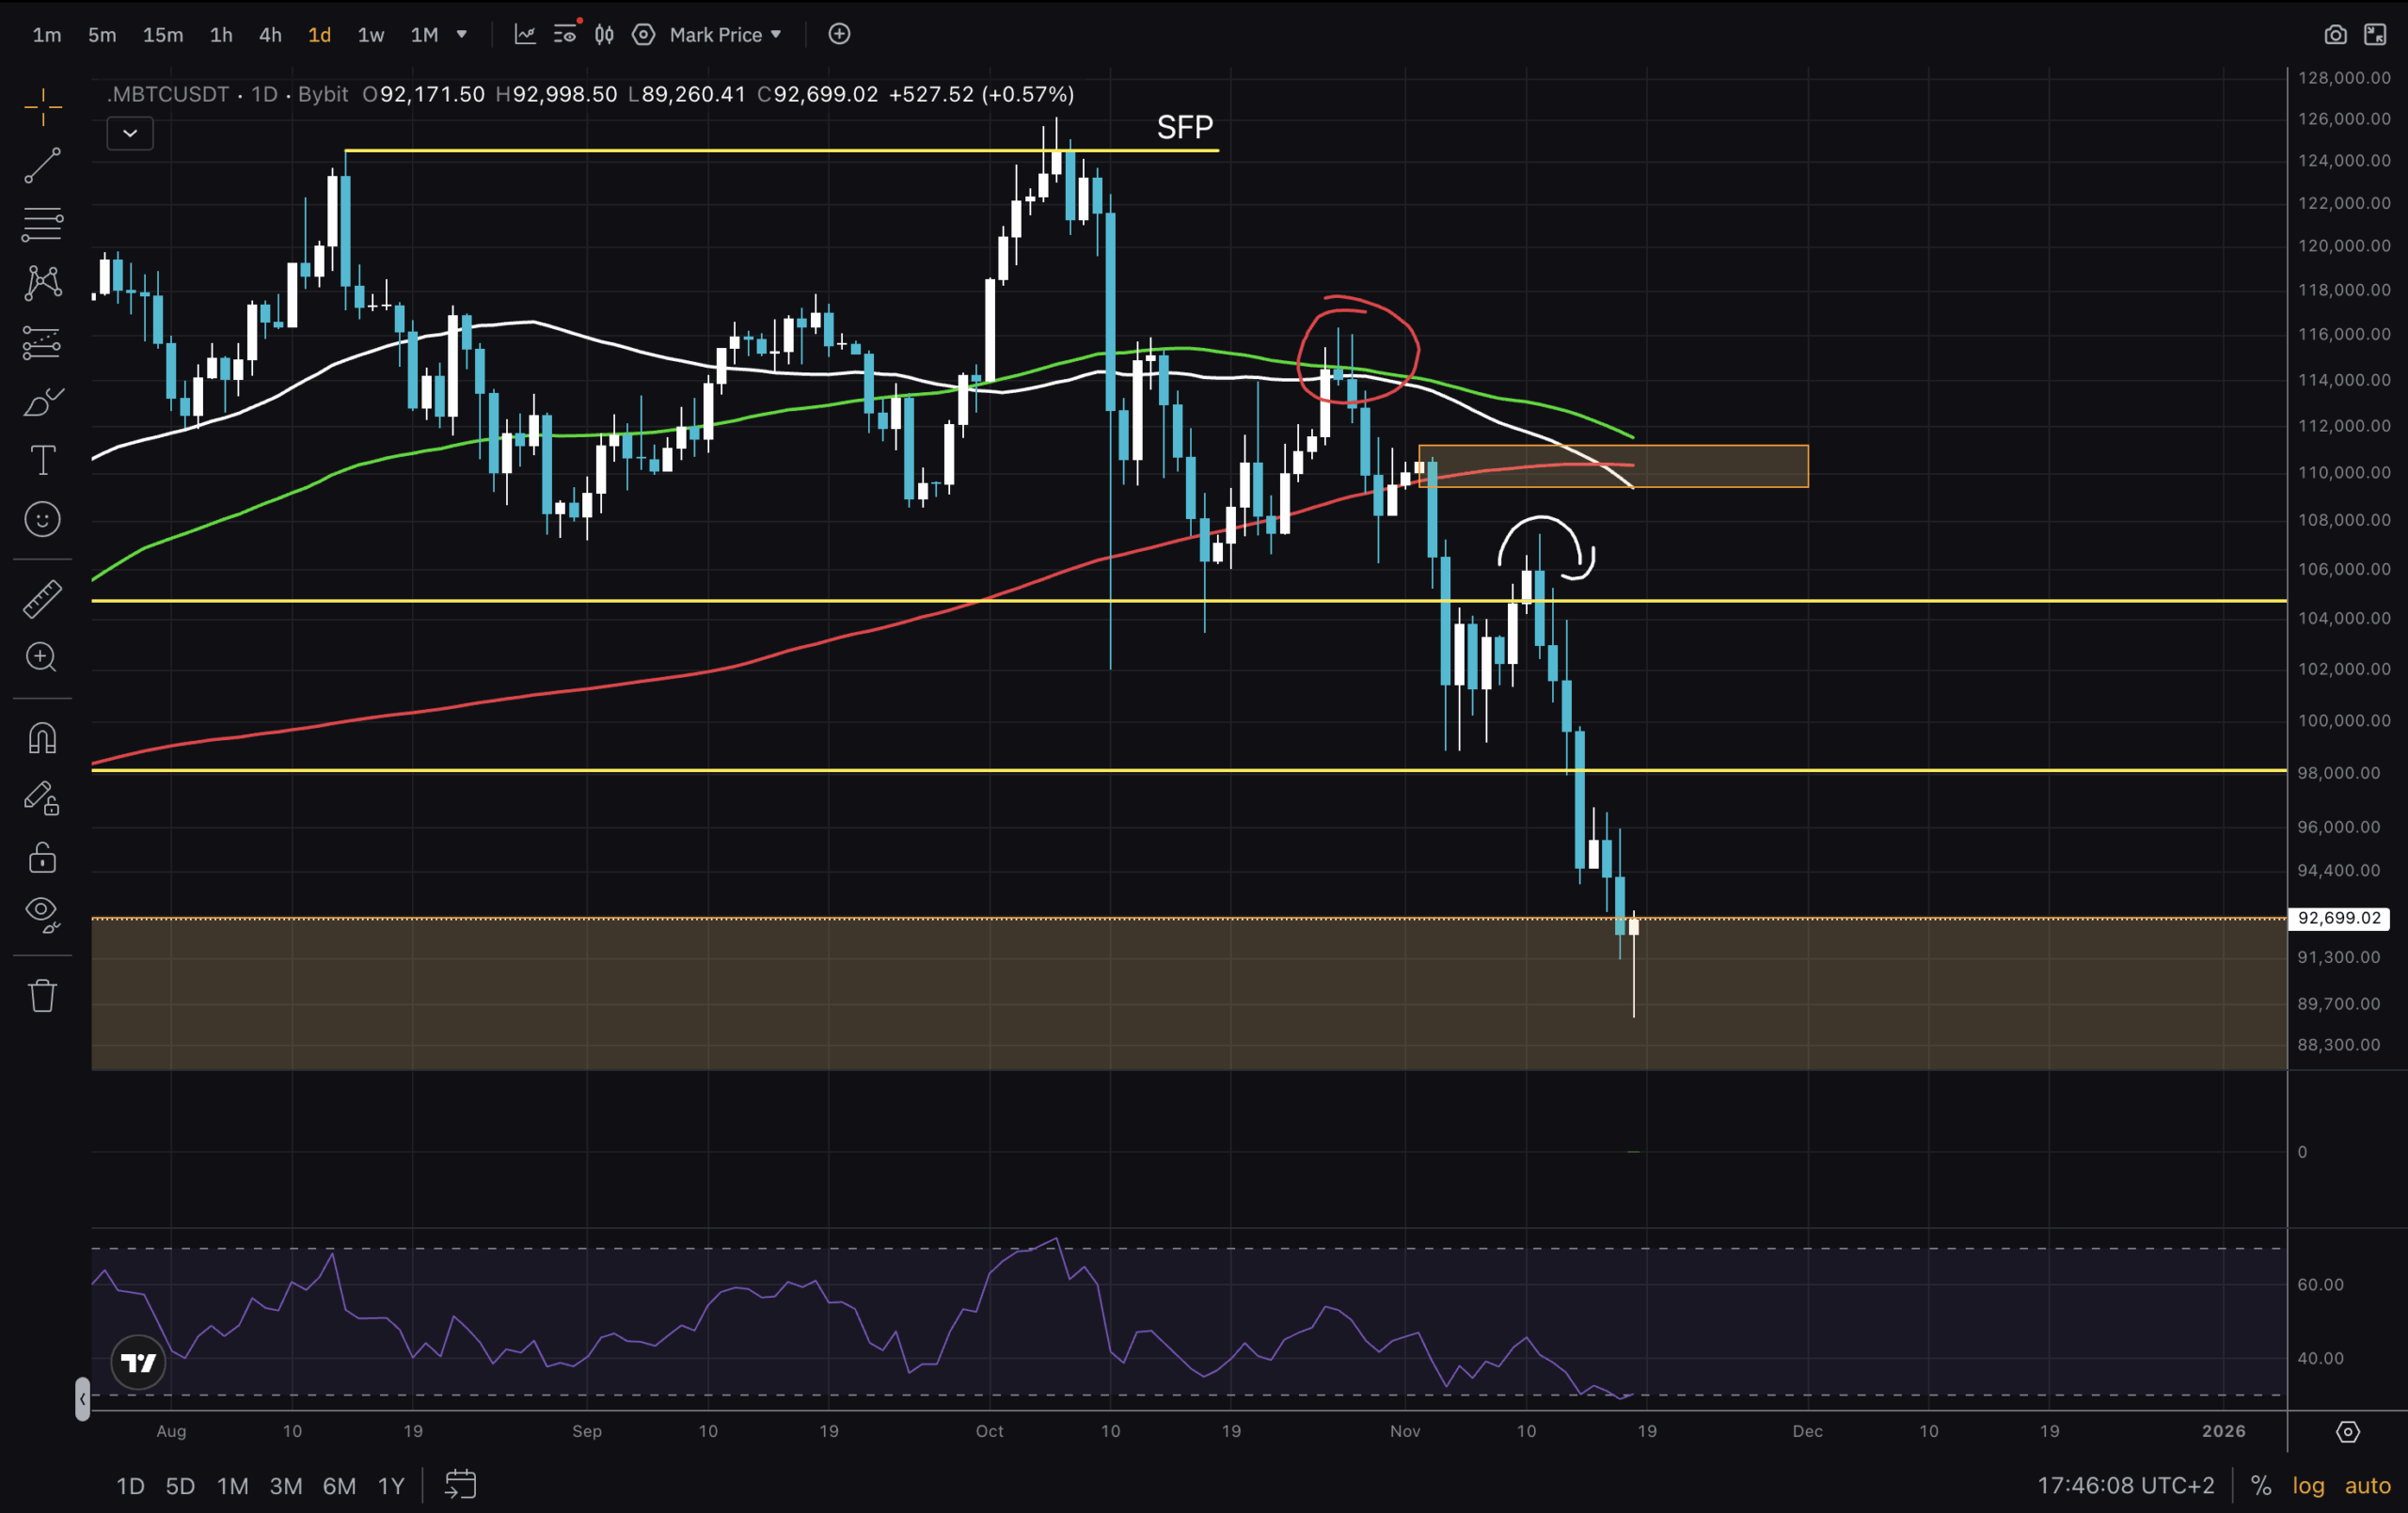
On the daily time frame, the BTC nuke still does not appear to have bottomed out. The RSI, on the other hand, is at its lowest. From our previous analysis, the $110,000 box was never even visited, nor any of the moving averages, before the price declined.
Some buyers are starting to step in now, but the bulls have a lot of work to do to repair the damage. At some point, we can expect the price to start fluctuating and at least a temporary bottom. Then retest one of the key levels or moving averages. The reaction to this new test will be revealing.
DISCOVER: 16+ New and Upcoming Binance Listings in 2025
Conclusions and Strategy: When will Bitcoin Price Rebound?
(Source – Tradingview, BTCUSD)
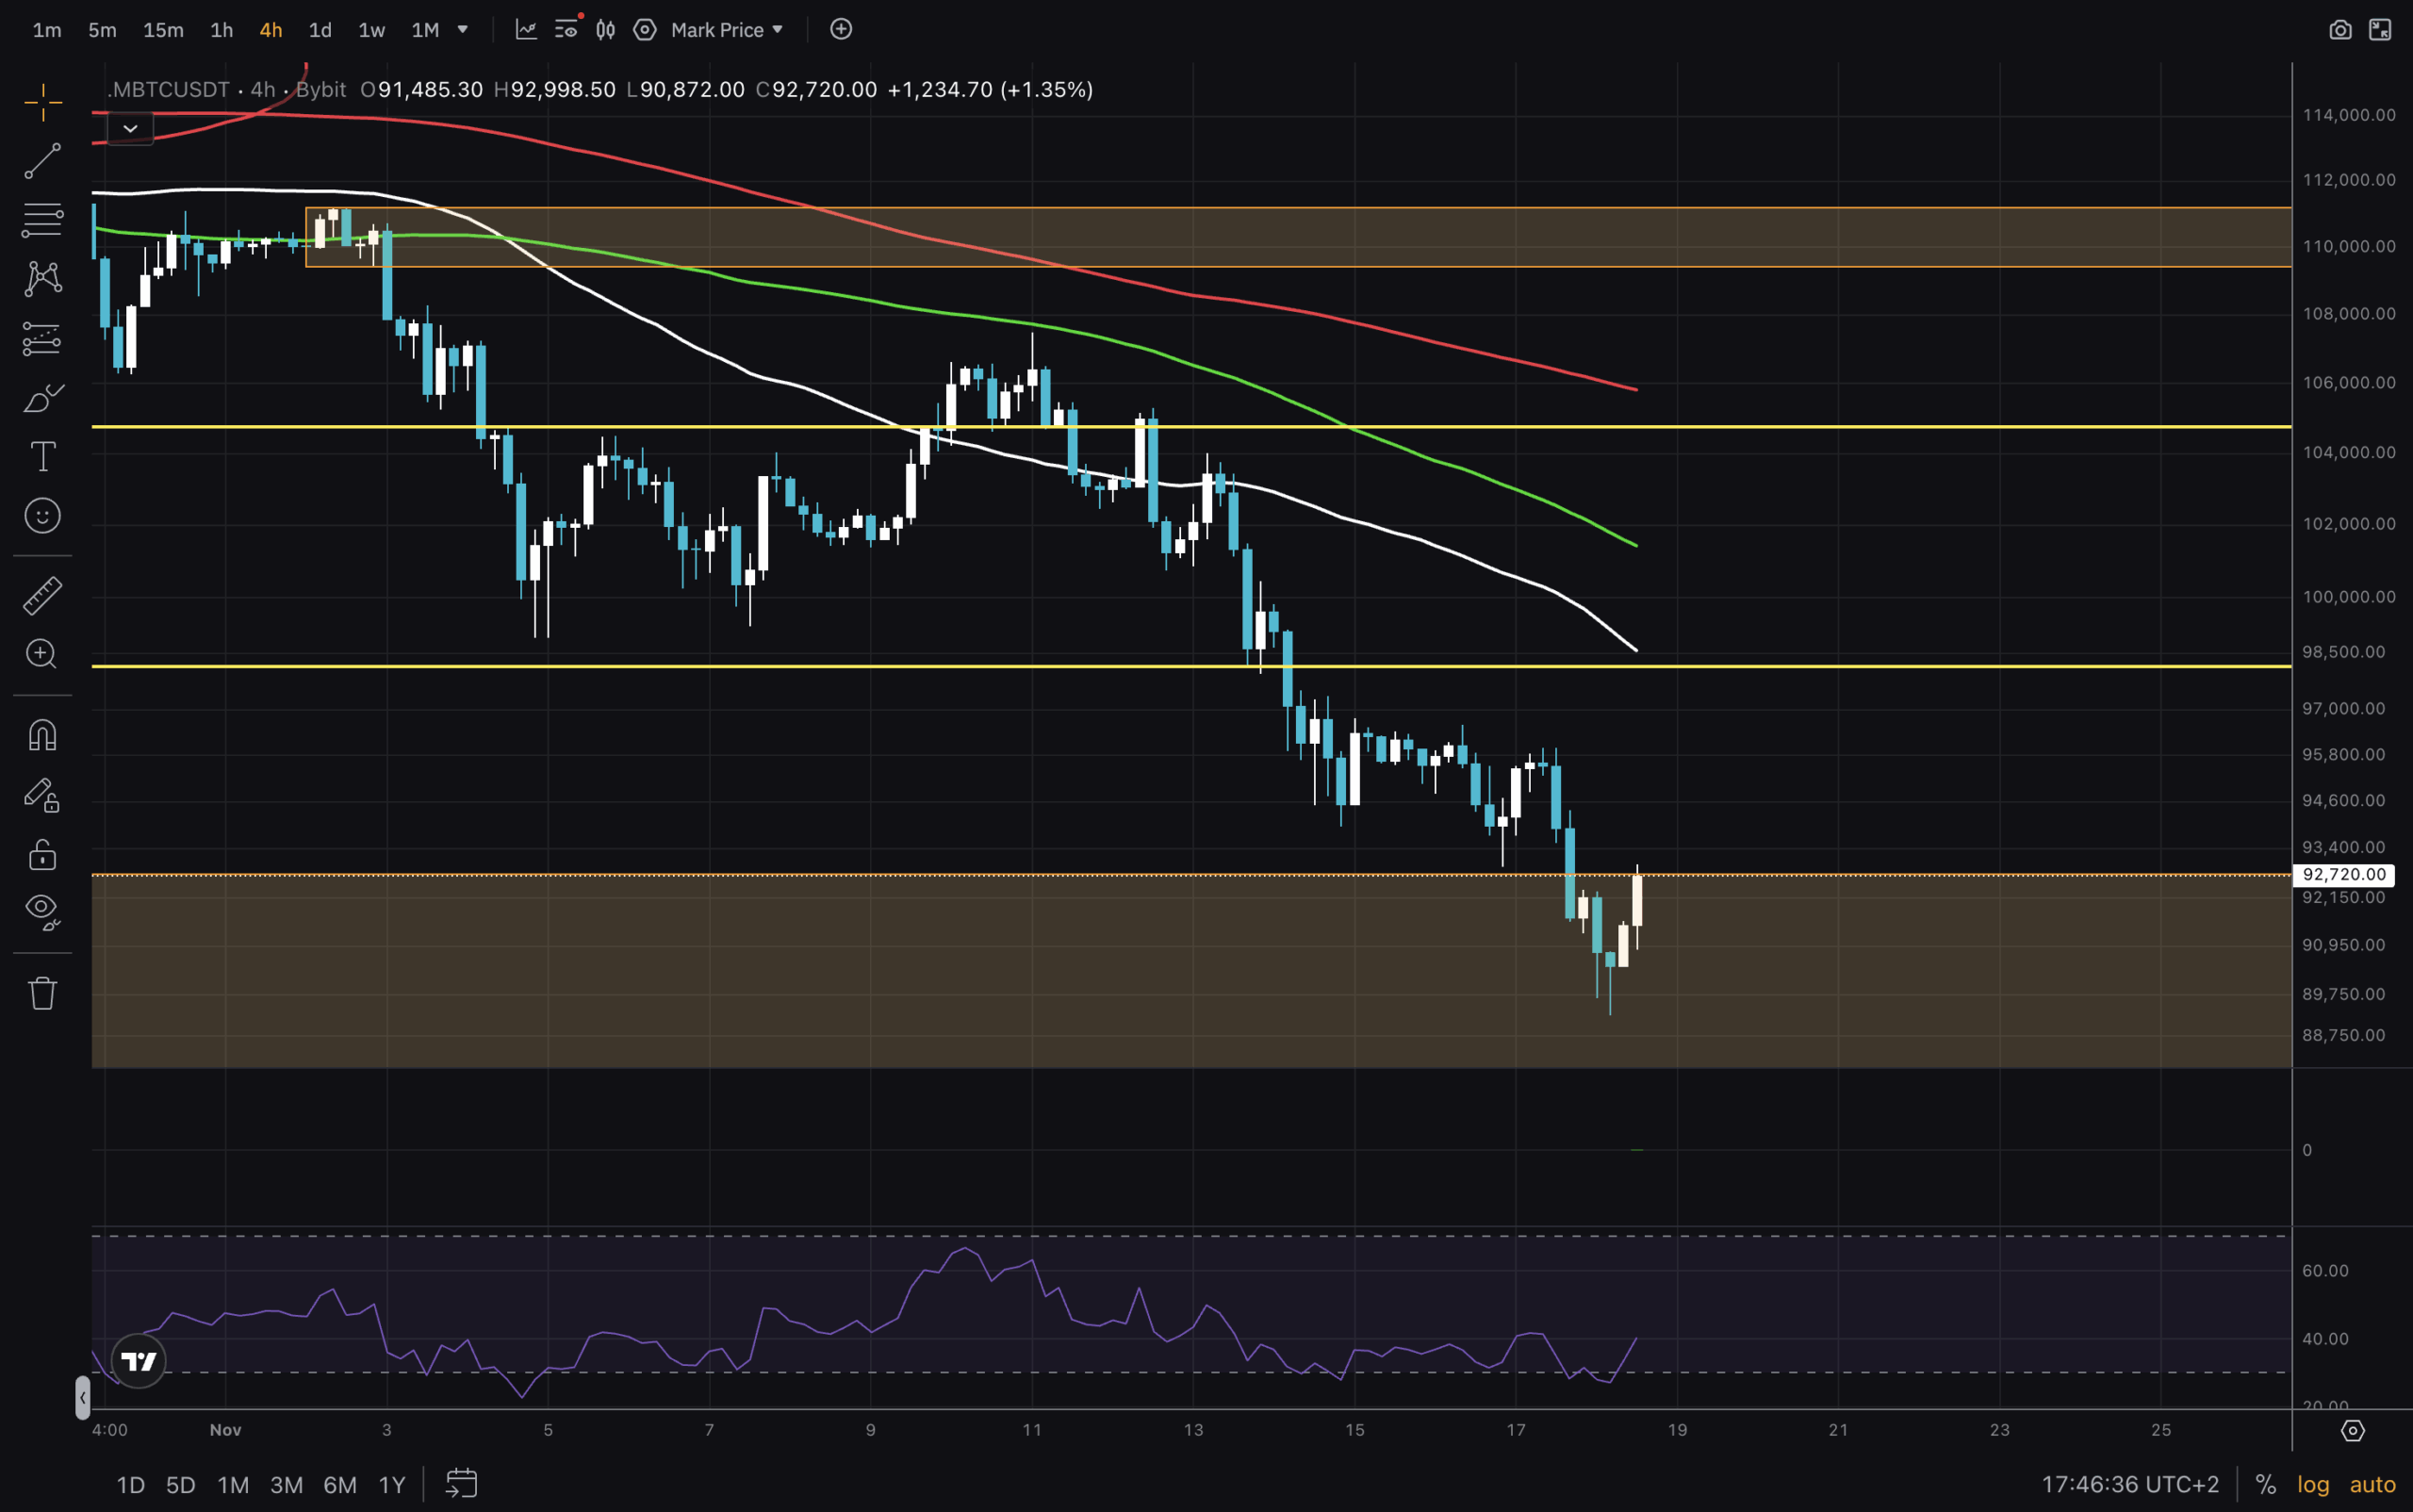
Since higher timeframes look like crap, traders can look for early signs of dips on shorter timeframes, such as the 4H. Immediately we notice that the RSI has reached a bottom. And we have the MAs in a downtrend formation. However, a retest of the MA50 could be imminent, possibly followed by a test of the MA100.
It might be difficult to trade this, so quick entries and exits are best in this type of environment. For now, it appears that returning to the $100,000 level is crucial for the long-term uptrend to continue.
DISCOVER: 9+ Best Memecoin to Buy in 2025
Join the 99Bitcoins News Discord here for the latest market updates
Bitcoin Price Falls Below $90,000: Where Are the Bulls?
-
The RSI on Daily is showing signs of bottoming.
-
The 4H chart should be monitored for early signs of a reversal.
-
If $100,000 is reclaimed, it could put the bulls in control
-
IMPORTANT – 1W FVG gaps filled. Potential background.
-
MA50 lost every week, but still in a bullish structure
Bitcoin Price Falls Below $90,000: Where Are the Bulls? appeared first on 99Bitcoins.