


Join our Telegram channel to stay up to date with the latest news
The price of Bitcoin edged up a fraction of a percent over the past 24 hours to trade at $91,480 as of 2:29 a.m. EST on trading volume that plunged 32% to $51.4 billion.
BTC is still down nearly 17% so far this month, as it heads toward its worst November performance since 2019. A year before that, Bbitcoin fell 36.5%, according to coin mechanism data.
Meanwhile, Sumit Kapoor, a crypto educator, noted that “every time Bitcoin has had a red November, December has also ended red.”
📉 Bitcoin is not having a good month of November$BTC is already down about 20% this month. Normally, November is one of Bitcoin’s strongest months, but with only 5 days remaining and a long Thanksgiving weekend ahead, it is on track to be the worst November since 2018.
Every time Bitcoin… pic.twitter.com/ADmSSttPW3
– Sumit Kapoor (@moneygurusumit) November 26, 2025
In another development, CME Group temporarily suspended trading on its Globex platform after a cooling outage at a CyrusOne data center. It arrived late on November 27, US time, and continued during Asian trading hours on November 28.
NEW: THE FUTURE CME WERE ARRESTED FOR MORE THAN 4 HOURS – MORE THAN 2 HOURS AGO, @CMEGroup SAYS ON
SOURCE: pic.twitter.com/yWMs1vvgYr
– DEGEN NEWS (@DegenerateNews) November 28, 2025
The suspension disrupted financial markets across various sectors, including benchmarks linked to the S&P 500 and Nasdaq 100. BTC and ETH futures were also taken offline. CME confirmed that it is working to restore all of its operations.
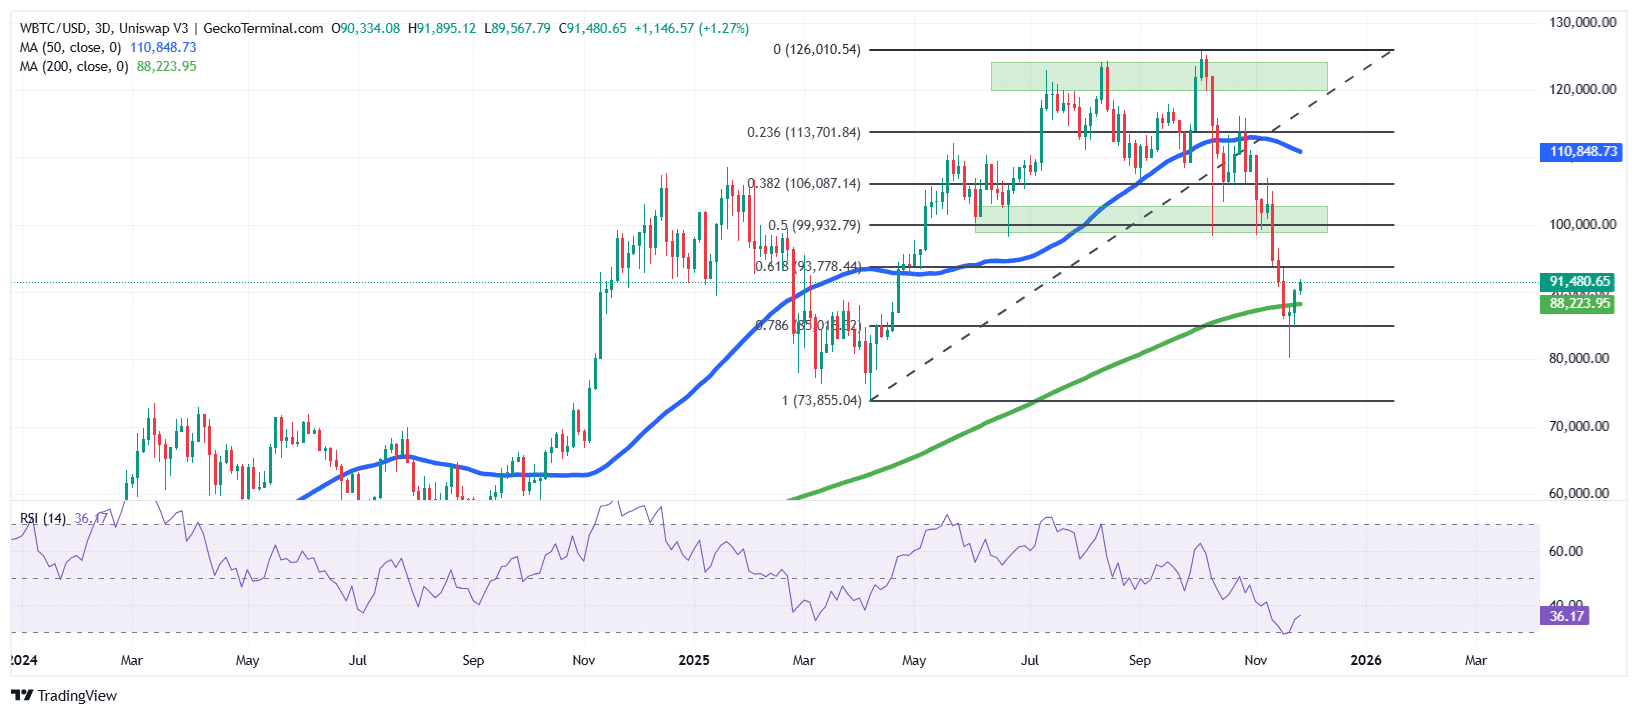
Bitcoin price shows signs of recovery above key resistances
THE BTC Priceafter a decline from the $108,000 level in February, found support around the $79,000 level between March and April.
This area allowed the price of Bitcoin to skyrocket, surpassing several key Fibonacci retracement levels. This surge pushed the price of BTC to an all-time high (ATH) of around $126,000.
However, after reaching this resistance level (0 Fib level), Bitcoin then corrected, falling further below the 0.786 Fib zone at around $80,500.
This level now acts as a cushion against downward pressure, with buyers stepping in to push the largest cryptocurrency by market cap towards the 0.618 Fib level ($93,778), which now serves as immediate resistance.
The falling ATH allowed BTC price to move below the 50-day simple moving average (SMA) ($110,848). Meanwhile, with the recovery now established, Bitcoin has surpassed the 200-day SMA ($88,223), a sign that BTC could be poised for a sustainable recovery on the 3-day chart.
Additionally, the Relative Strength Index (RSI) is also on the verge of a retracement, as the indicator recovers from the oversold zone of 30, currently at 36, and continues to rise. This suggests that buyers could step in to regain control, which could be a bullish signal.
BTC Price Prediction
According to the BTC/USD 3-day time frame chart analysis, Bitcoin is preparing for a sustained recovery, considering the rise above the 200-day SMA and the upcoming RSI.
If the rally continues and BTC price regains the $93,778 level (.618 Fib Level), bulls could push the asset even further, targeting prices above the $100,000 zone, a previous support zone.
Conversely, if the bears break above the bearish level of $85,016, Bitcoin price could further decline to the support zone around $73,855.
Ali Martinez, an influential analyst with over 163,000 followers on X, says the $84,570 level is a key area to watch on the downside, and the $112,340 area on the upside.
For Bitcoin $BTC$84,570 is the support that matters, and $112,340 is the ceiling to watch. pic.twitter.com/rI0dhCgiMK
– Ali (@ali_charts) November 27, 2025
Related news:
Best Wallet – Diversify your crypto portfolio

- Easy-to-use, feature-driven crypto wallet
- Get Early Access to Upcoming Token ICOs
- Multi-chain, multi-wallet, non-custodial
- Now on App Store, Google Play
- Stake to win a $BEST native token
- More than 250,000 active users per month
Join our Telegram channel to stay up to date with the latest news