This article is also available in Spanish.
At the end of the year, a renowned analyst suggested that Bitcoin (BTC) could see a rebound in the New Year after the flagship crypto surged 4.2% to retest a key level.
Related reading
Bitcoin experiences end-of-year slowdown
Bitcoin has struggled to maintain the mid-zone of its month-long price range as the crypto market experiences a year-end slowdown. In December, BTC surpassed the $100,000 mark for the first time, hitting a new all-time high of $108,353 mid-month.
Over the past 30 days, the flagship crypto has moved between $90,000 and $108,000, hovering between $96,000 and $102,000 for most of the month. Nonetheless, Bitcoin has seen a 10.5% decline since hitting its ATH, failing to hold the $98,000 level over the past two weeks.
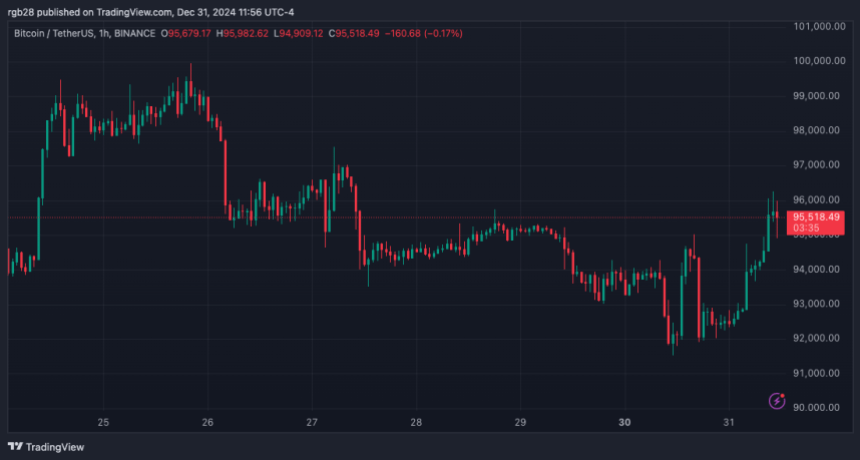
The largest cryptocurrency by market capitalization saw a brief recovery on December 25, but quickly lost its gains from the Christmas rally. Since then, the BTC price has recorded its deepest retracement since early December.
Bitcoin fell below the crucial $92,000 support zone on Monday, falling as low as $91,530 before recovering, raising concerns about BTC’s monthly close. However, New Year’s Eve began with a 4.2% rise throughout the morning, fueling end-of-year optimism about a price rebound.
The cryptocurrency price rose from $92,000 to $96,000 before returning to the $95,000 support zone. As the price of BTC climbed, crypto analyst Ali Martinez noted that TD Sequential showed a buy signal on the 12-hour chart, potentially signaling a price rebound on New Year’s Day.
“Everything is fine” for the BTC rally
Martinez suggested that “a sustained close above $94,700 could lead to a rebound to $97,500.” As the analyst previously pointed out, this level is one of BTC’s most important support zones, and its recovery is key to the cryptocurrency’s near-term rally.
On the contrary, “losing $92,500 as support will invalidate the bullish signal,” Martinez added. Losing this level could also send BTC to the $70,000 level based on the UTXO Realized Price Distribution (URPD) chart.
The analyst said that a 25% collapse to the $70,000 mark is possible as the URPD chart shows minimal support below the key support wall.
Related reading
Meanwhile, James Van Straten noted that “everything is fine” despite BTC’s current price action. The analyst pointed out that “this cycle, like the previous three cycles for BTC, have all seen corrections at this point after the halving,” adding that “corrections start later and end later.” Perhaps, because of the extended cycles.
At the time of writing, Bitcoin is trading at $94,949, an increase of 1% on the daily time frame.

Featured image from Unsplash.com, chart from TradingView.com


