


Glassnode’s accumulation trend score just reached 0.04. Basically zero, signaling a bearish Bitcoin price forecast.
This means that holders of almost all portfolio sizes have turned to active selling. This is one of the most bearish readings this metric can print.
And yet, the price of Bitcoin is still around $70,000.
So which one is lying? The price or on-chain data. This is the question every holder needs to answer right now.
DISCOVER: How institutions are still buying Bitcoin during geopolitical troughs
What is the Accumulation Trend Score – and why is 0.04 so alarming?
The Accumulation Trend Score is like an in-store inventory tracking tool. Empty shelves mean people are buying. The shelves are overflowing, which means everyone is returning their stuff and no one is shopping.
Right now, the shelves are full. Score sitting at 0.04.
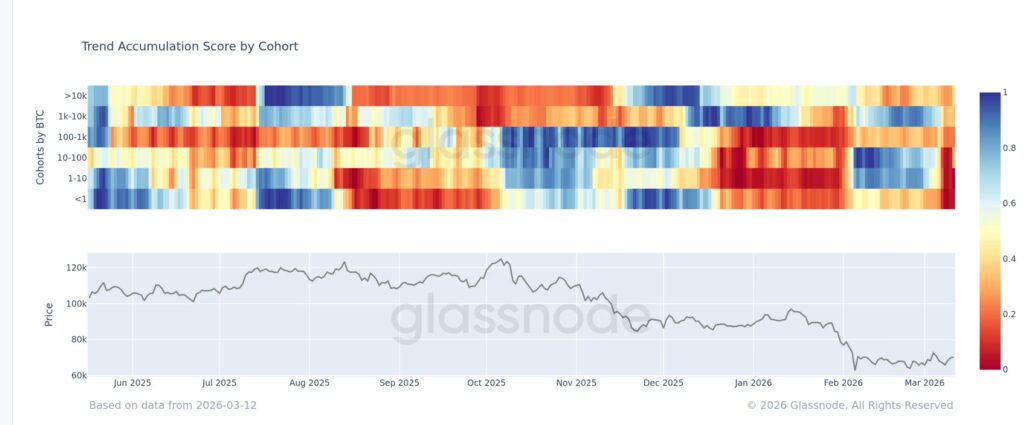
(Source: Glassnode)
Each portfolio level sells simultaneously. Retailers, mid-sized holders, even whales. This is a distribution phase.
Here’s what that means in simple terms. Large holders sell at a stable price. New buyers see $70,000 and think it’s safe. The price holds just long enough to attract them. Then it breaks.
The retail business buys the bag.
What makes this situation unusual is that retail is currently leading sales. The whales normally come out first. Having larger portfolios added to this only makes things worse.
Currently, price stability is not the same as security.
DISCOVER: How to Read Whale Portfolio Behavior as a Market Signal
Is the $70,000 Level a Trapdoor for Bitcoin Price
$70,000 is the limit. It all depends on her outfit.
The bullish case is that institutional demand absorbs the selling and $70,000 becomes a confirmed bottom. Bear case: sell gains, stop-loss cascade, and the next stop is $60,000 to $65,000.
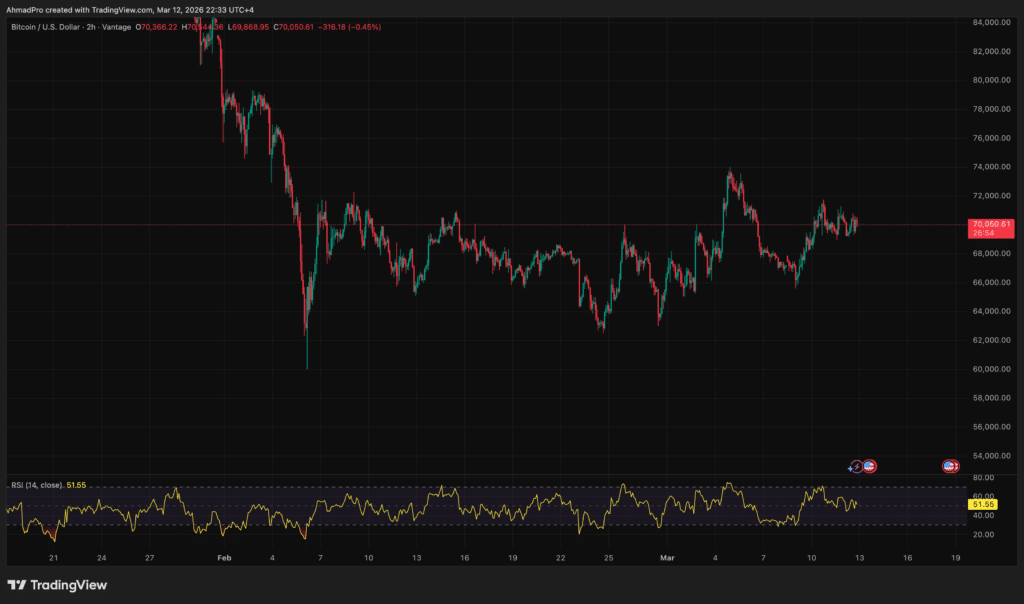
(Source: BTCUSD/TradingView)
The macro doesn’t help. Dollar above 99.5. 10-year yield greater than 4.2%. Oil at $100. All this weighs on risky assets.
Here is the trap to avoid. Price stability during a distribution phase is not a green light. This is the mechanism that makes the trap work. Coins flood the exchanges. The volume dries up. The price holds just long enough to attract new buyers. Then it breaks.
The distribution at the end of the cycle does not mean that the uptrend is over. This means you’re no longer in the early rounds where every dip is a gift.
Watch for the accumulation trend score to return above 0.4. This is the signal that buyers are coming back. Meanwhile, the chart looks calmer than the data below it.
The post Bitcoin Sales Rise in Wallets with Holds of $70,000 appeared first on 99Bitcoins.