


BTC USD price just hit a huge resistance wall at $75,000. And right on cue, the chain alarm bells started ringing. A sudden surge in exchange flows, with coins moving from private wallets to trading platforms, hit a four-week high this week.
Hourly data from March 16 showed that more than 6,100 BTC was transferred across exchanges in a single burst. Historically, this indicates that investors are preparing to sell. But here’s the problem: The liquidation hasn’t happened yet, and now investors are scratching their heads.
This comes as Bitcoin has spent the last 24 hours making very little movement in either direction, up just +0.2% on the daily chart as it trades at $73,900, with $34 billion in daily trading volume.
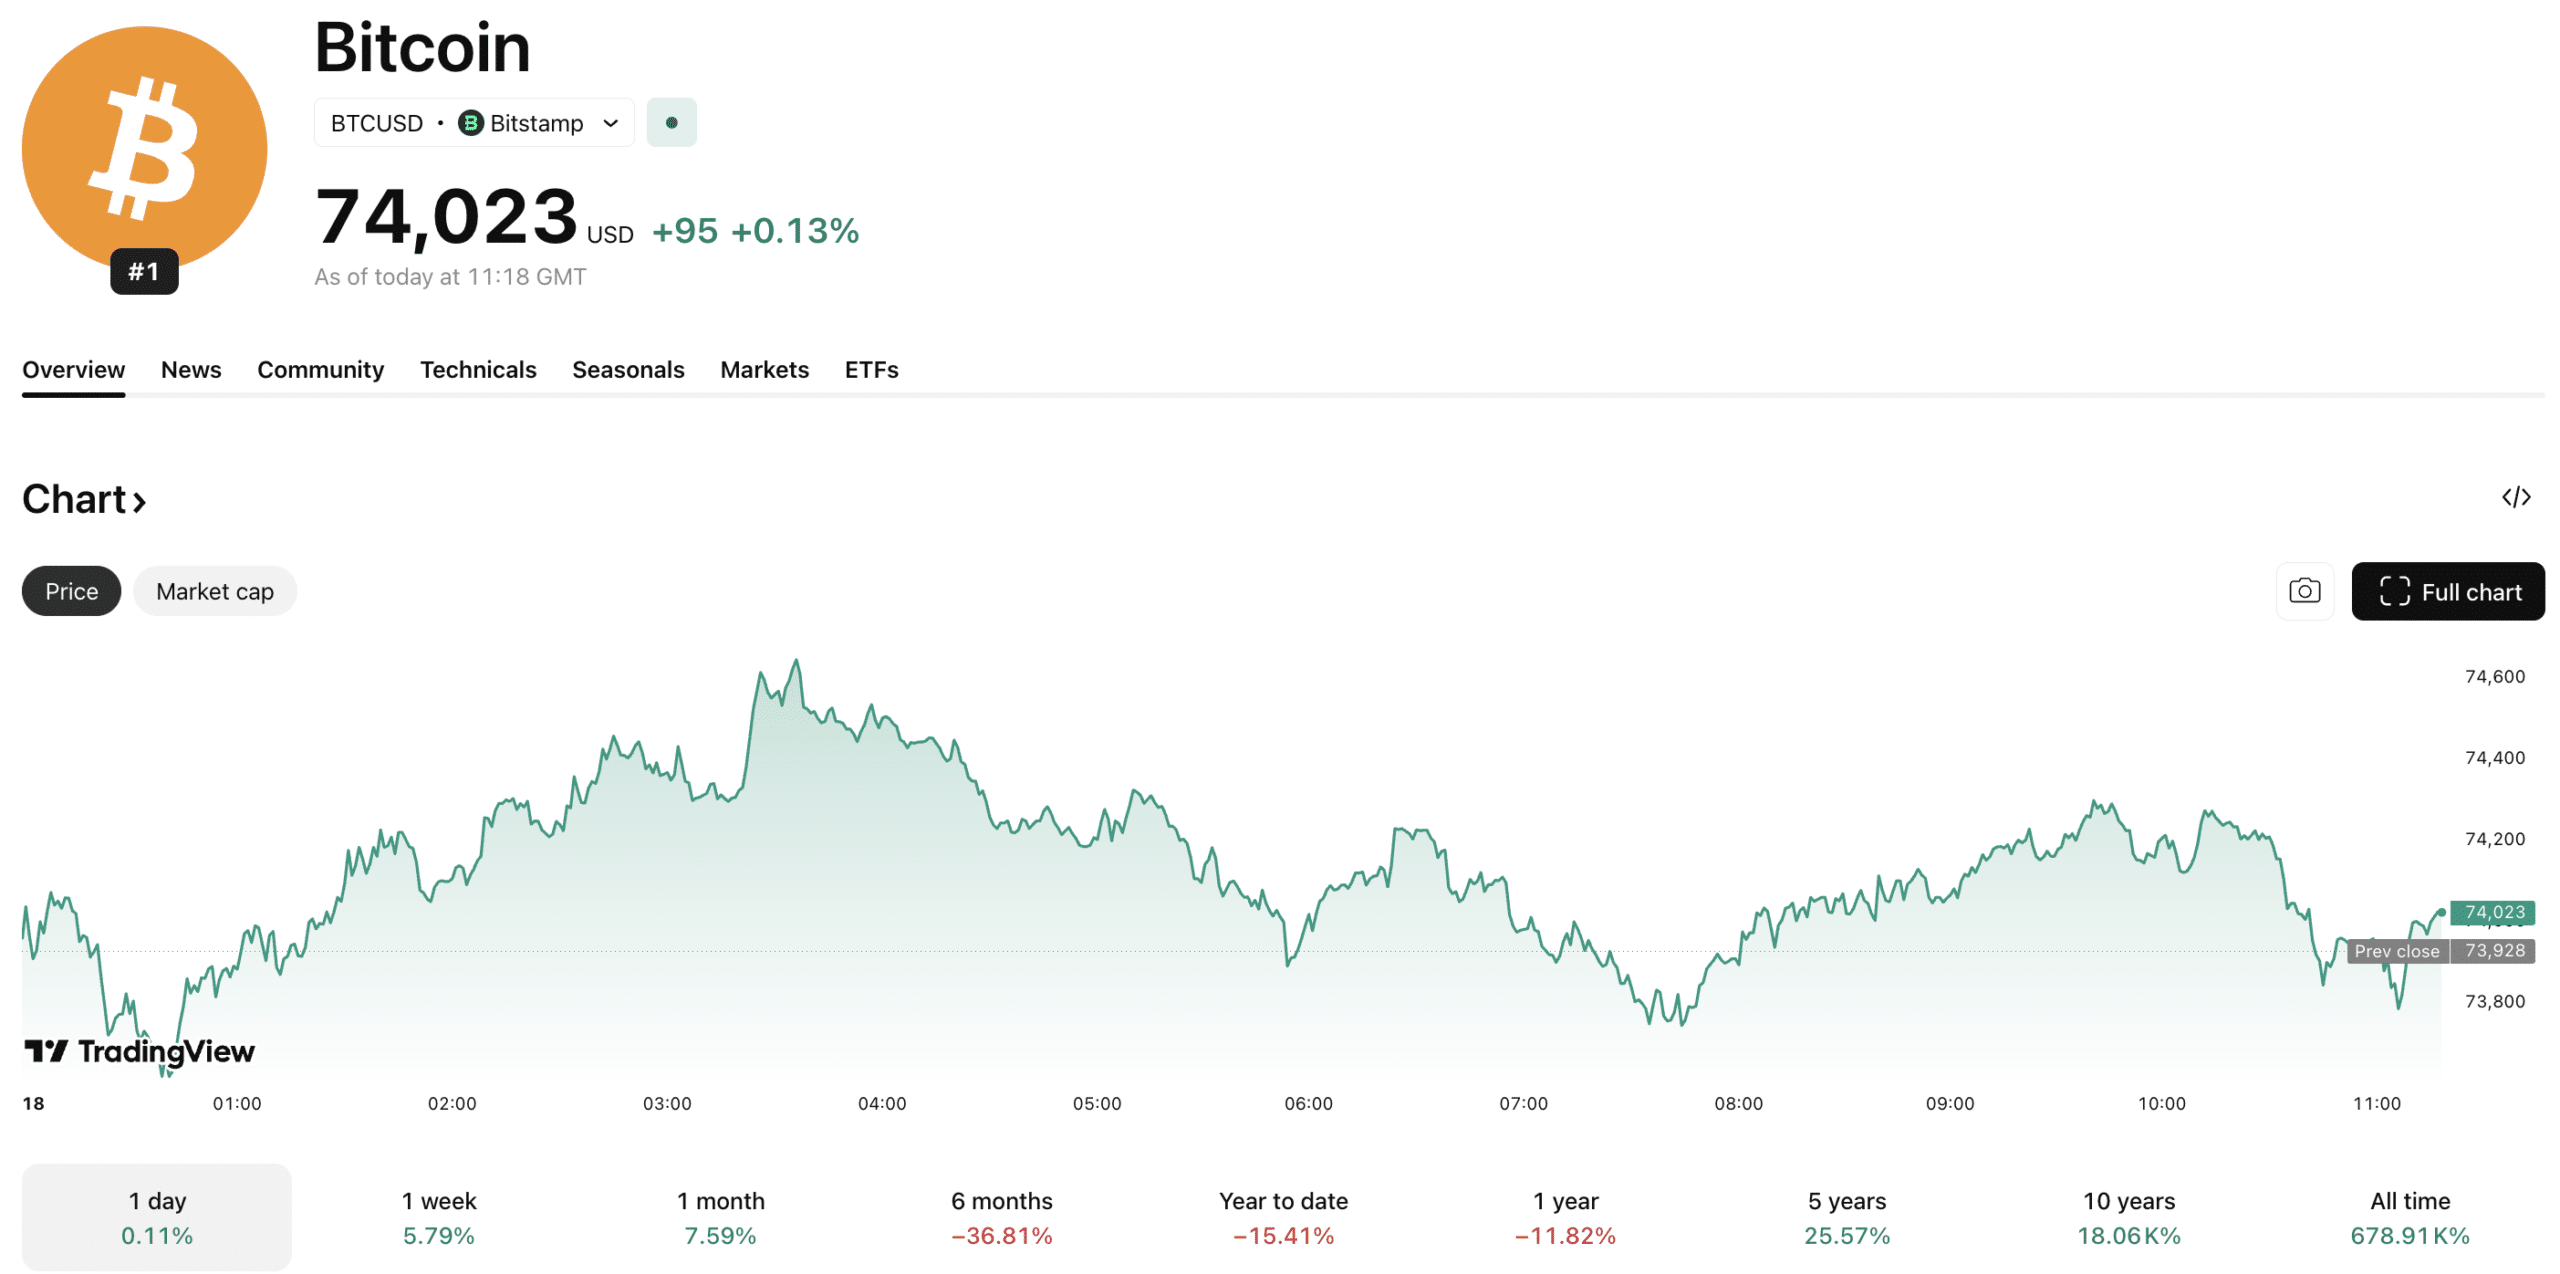
(SOURCE: TradingView)
What do exchange flows actually signal?
For beginners, “foreign exchange entries” may sound like technical noise. Think of it like a used car market. If thousands of people suddenly drive their cars to the dealership the same afternoon, the supply of cars for sale skyrockets. To sell these cars, dealers usually have to lower prices.
When Bitcoin moves from a private wallet (cold storage) to an exchange, it usually means one thing: the owner wants the ability to sell. They may not sell immediately, but they are positioning themselves to exit.
According to CryptoQuant Datathe recent increase is significant. This suggests that profit taking is visible on the horizon. However, inflows only constitute potential selling pressure. If buyers step in and buy these parts immediately, like a line of customers waiting at the dealership, the price doesn’t need to go down. This is the battle we are watching right now.
Binance Flow Collapse, USDT Printing, ETF Loading – Smart Money Moving?
“Historically, such declines in foreign exchange flows reduce selling pressure as fewer coins are available in spot markets.” – By Amr Taha
Complete analysis
pic.twitter.com/sEgb7x9RDx
– CryptoQuant.com (@cryptoquant_com) March 16, 2026

The $75,000 Stress Test: What the Data Shows
On March 16, hourly Bitcoin flows across exchanges reached 6,100 BTC, the highest level recorded since late February. Julio Moreno, head of research at CryptoQuant, noted that this behavior often precedes increased selling pressure.
But the detail that matters most is who moves the pieces. The data shows that “large deposits” accounted for 63% of these total inflows. This is the highest share of whale activity since October 2025. This is not retail traders panic selling $100 worth of BTC. These are large entities, potentially whales or institutions, that vary in size.
Despite this “sell signal”, the market did not collapse. For what? Because the other side of the market is heavy. According to CoinGlass data, spot Bitcoin ETFs continue to absorb supply, acting as a massive buffer. We are seeing a clash between old profit-taking whales and new institutional capital flowing in via ETFs.
BTC USD Price Analysis: Is $75,000 the Ceiling or the Floor?
$BTC fell after 6 of 6 recent FOMC meetings pic.twitter.com/24i6xlsaeb
– BitcoinHyper (@BitcoinHypers) March 17, 2026
Price is currently testing the $74,000 to $75,000 range. This is the “line in the sand”. If Bitcoin could clearly cross the $75,000 mark with significant volume, it would invalidate the bearish signal from exchange inflows. This would mean that demand is strong enough to absorb the sale of the whales.
However, if the price declines here, the peak inflow suggests that a pullback is likely. The first major support is between $71,500 and $72,000. If this floor gives way, the trap door could open towards the $69,000 region.
Momentum indicators such as the 14-day RSI have moved from oversold territory to around 52, showing healthy momentum without being overextended.
The market is not currently “overbought,” which gives the bulls some hope. But the sheer volume of coins listed on exchange order books currently poses a heavy drag on price growth.
Currently, the market is waiting for the results of today’s FOMC meeting and subsequent comments from Jerome Powell to determine the direction the BTC/USD price could take.
Follow 99Bitcoins on X (Twitter) For the latest market updates and subscribe on YouTube for daily market analysis from experts.
DISCOVER: The Best Crypto Presales to Watch Now
The post Bitcoin Exchange Inflows Spike as BTC USD Price Hits $75,000 Resistance appeared first on 99Bitcoins.