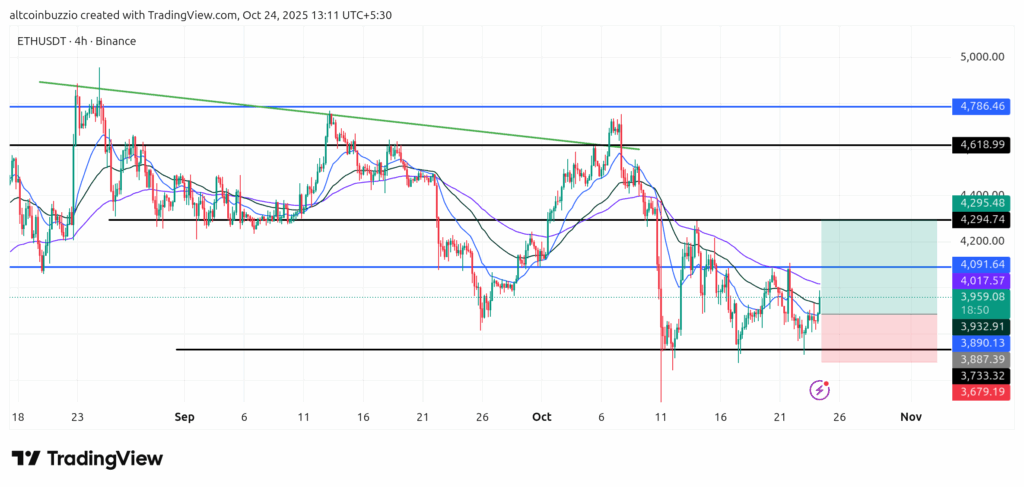
Will $ETH burst or fall sharply? Traders are watching this development closely. Look for clear signals in the chart. Read to the end. You will find hidden price targets that most traders miss.
Ethereum is trading at $3959 today. $ETH is trading below the important support level of $4,000. This is the 100 day EMA. Bears show current control. Discover the next targets.
What are the support and resistance levels for $ETH?
| Level | Price (USD) | Description |
|---|---|---|
| Support 1 | $4,000 | 100 EMA is the 100-day exponential moving average. This is the average price over the last 100 days. It shows market trends in the medium or long term. |
| Support 2 | $3,800 | Bollinger bands are volatility bands. They expand and contract in response to market volatility. The lower Bollinger Band is the smallest deviation from the 20-day simple moving average. |
| Resistance 1 | $4,100 | 50 EMA is the 50-day exponential moving average. This is the average price over the last 50 days. It shows market trends in the short or medium term. |
| Resistance 2 | $4,250 | The upper Bollinger band is the upper deviation from the 20-day simple moving average. |
FAQs
What Ethereum price targets should I consider?
Support $4,000. Resistance $4100. Target $5,823.
Is Ethereum bullish?
The stochastic RSI is 18. This shows oversold. Resistance lies at $4,100. The bears are in control.
How to set stop-loss levels for Ethereum?
Place stops below $3,800. This protects positions. Short sellers are using $4,100.
What do Ethereum moving averages indicate?
EMA50 is at $4,100. EMA100 is at $4,000. Ethereum is trading at $3959. The price is below both EMAs. This shows a bearish trend.
What should a buyer or seller do?
Buyers are waiting for confirmation. Sellers are aiming for $3,800. Stops above $4,100. Long profits at $5,823. Manage risks.
How Do Fibonacci Levels Affect Ethereum Price?
The 61.8% Fibonacci level is $3,221. The 138.2% Fibonacci extension is $5,823. This is an upward target.
What does $ETH’s momentum show?
Stochastic RSI K reads 15. Overbought above 80. Oversold below 20. ETH momentum is oversold. Selling pressure is strong.
Conclusion
Ethereum shows weakness below the $4,000 support. Eyes on $3,800 for breakdown risk. The dynamic favors the bears. Another liquidation could follow. Stay cautious, protect capital.

Disclaimer
The information discussed by Altcoin Buzz does not constitute financial advice. This is for educational, entertainment and informational purposes only. Any information or strategies presented are the thoughts and opinions of the editors/reviewers, and their risk tolerance may differ from yours. We are not responsible for any losses you may incur as a result of any investment directly or indirectly related to the information provided. Ethereum and other cryptocurrencies are high-risk investments; therefore, please do your due diligence. Copyright Altcoin Buzz Pte Ltd.
The article ETH Price Today: Oversold Dynamics Suggest a Bounce appeared first on Altcoin Buzz.


