


The month of October was not kind to the crypto world as prices fell instead of rising. Bad surprise for many. Can we expect better performances for November? Will ETH USD explore up to $10,000 as many predict? History shows that there is always money to be made in the markets. Let’s find out what information technical analysis can provide for the coming weeks.
Ethereum Exchange Supply on Binance Falls to Lowest Level Since Last May
“Overall, current indicators reflect a transitional phase in the Ethereum market, where investors appear to be accumulating and holding.” – By @ArabxChain
Learn more
pic.twitter.com/vNLCJQyuIl
– CryptoQuant.com (@cryptoquant_com) November 11, 2025

Today, even though the market is down (most likely due to ETH ETF selling pressure), there is abundant on-chain activity and trading volume. In itself, this is basically a good sign. Some even say the whales are back and buying. .cwp-coin-chart path svg { strokewidth: 0.65 !important; } .cwp-coin-widget-container .cwp-graph-container.positive svg path: nth-of-type (2) { trait: #008868 !important; } .cwp-coin-widget-container .cwp-coin-trend.positive { color: #008868 !important; background-color: transparent !important; } .cwp-coin-widget-container .cwp-coin-popup-holder .cwp-coin-trend.positive { border: 1px solid #008868; border-radius: 3px; } .cwp-coin-widget-container .cwp-coin-trend.positive::before { border-bottom: 4px solid #008868 !important; } .cwp-coin-widget-container .cwp-coin-price-holder .cwp-coin-trend-holder .cwp-trend { background-color: transparent !important; } .cwp-coin-widget-container .cwp-graph-container.negative svg path: nth-of-type (2) { trait: #A90C0C !important; } .cwp-coin-widget-container .cwp-coin-popup-holder .cwp-coin-trend.negative { border: 1px solid #A90C0C; border-radius: 3px; } .cwp-coin-widget-container .cwp-coin-trend.negative { color: #A90C0C !important; background-color: transparent !important; } .cwp-coin-widget-container .cwp-coin-trend.negative::before { border-top: 4px solid #A90C0C !important; }
![]()
Ethereum
1.33%
![]()
Ethereum
ETH
Price
$3,465.52
1.33% /24h
Volume in 24 hours
$30.93 billion
Price 7d
// Make SVG responsive jQuery (document). svg.attr(‘viewBox’, ‘0 0 ‘ + originalWidth + ‘ ‘ + originalHeight); } svg.removeAttr(‘width’).removeAttr(‘height’); } });
the disappearance of supply from exchanges, such as Binance, is a prerequisite for sharp movements. Before continuing, please read the previous ETH article here.
DISCOVER: The 12+ Most Popular Crypto Presales to Buy Now
ETH USD Price History Background and ETH BTC Outlook

(Source – Tradingview, ETHBTC)
Let’s start this analysis with the Ethereum versus Bitcoin 3-month chart. What we can see here is clearly that when Ethereum is running, it is explosive and shorter than the drawdown periods. There aren’t many candles going out on this 9 year old chart. What is positive here is the rebound from the 0.01759 level. This essentially created a morning star pattern, which is a bullish sign and indicates a potential reversal. This would mean that ETH will outperform BTC – also known as Alt Season.
DISCOVER: The best new cryptocurrencies to invest in in 2025
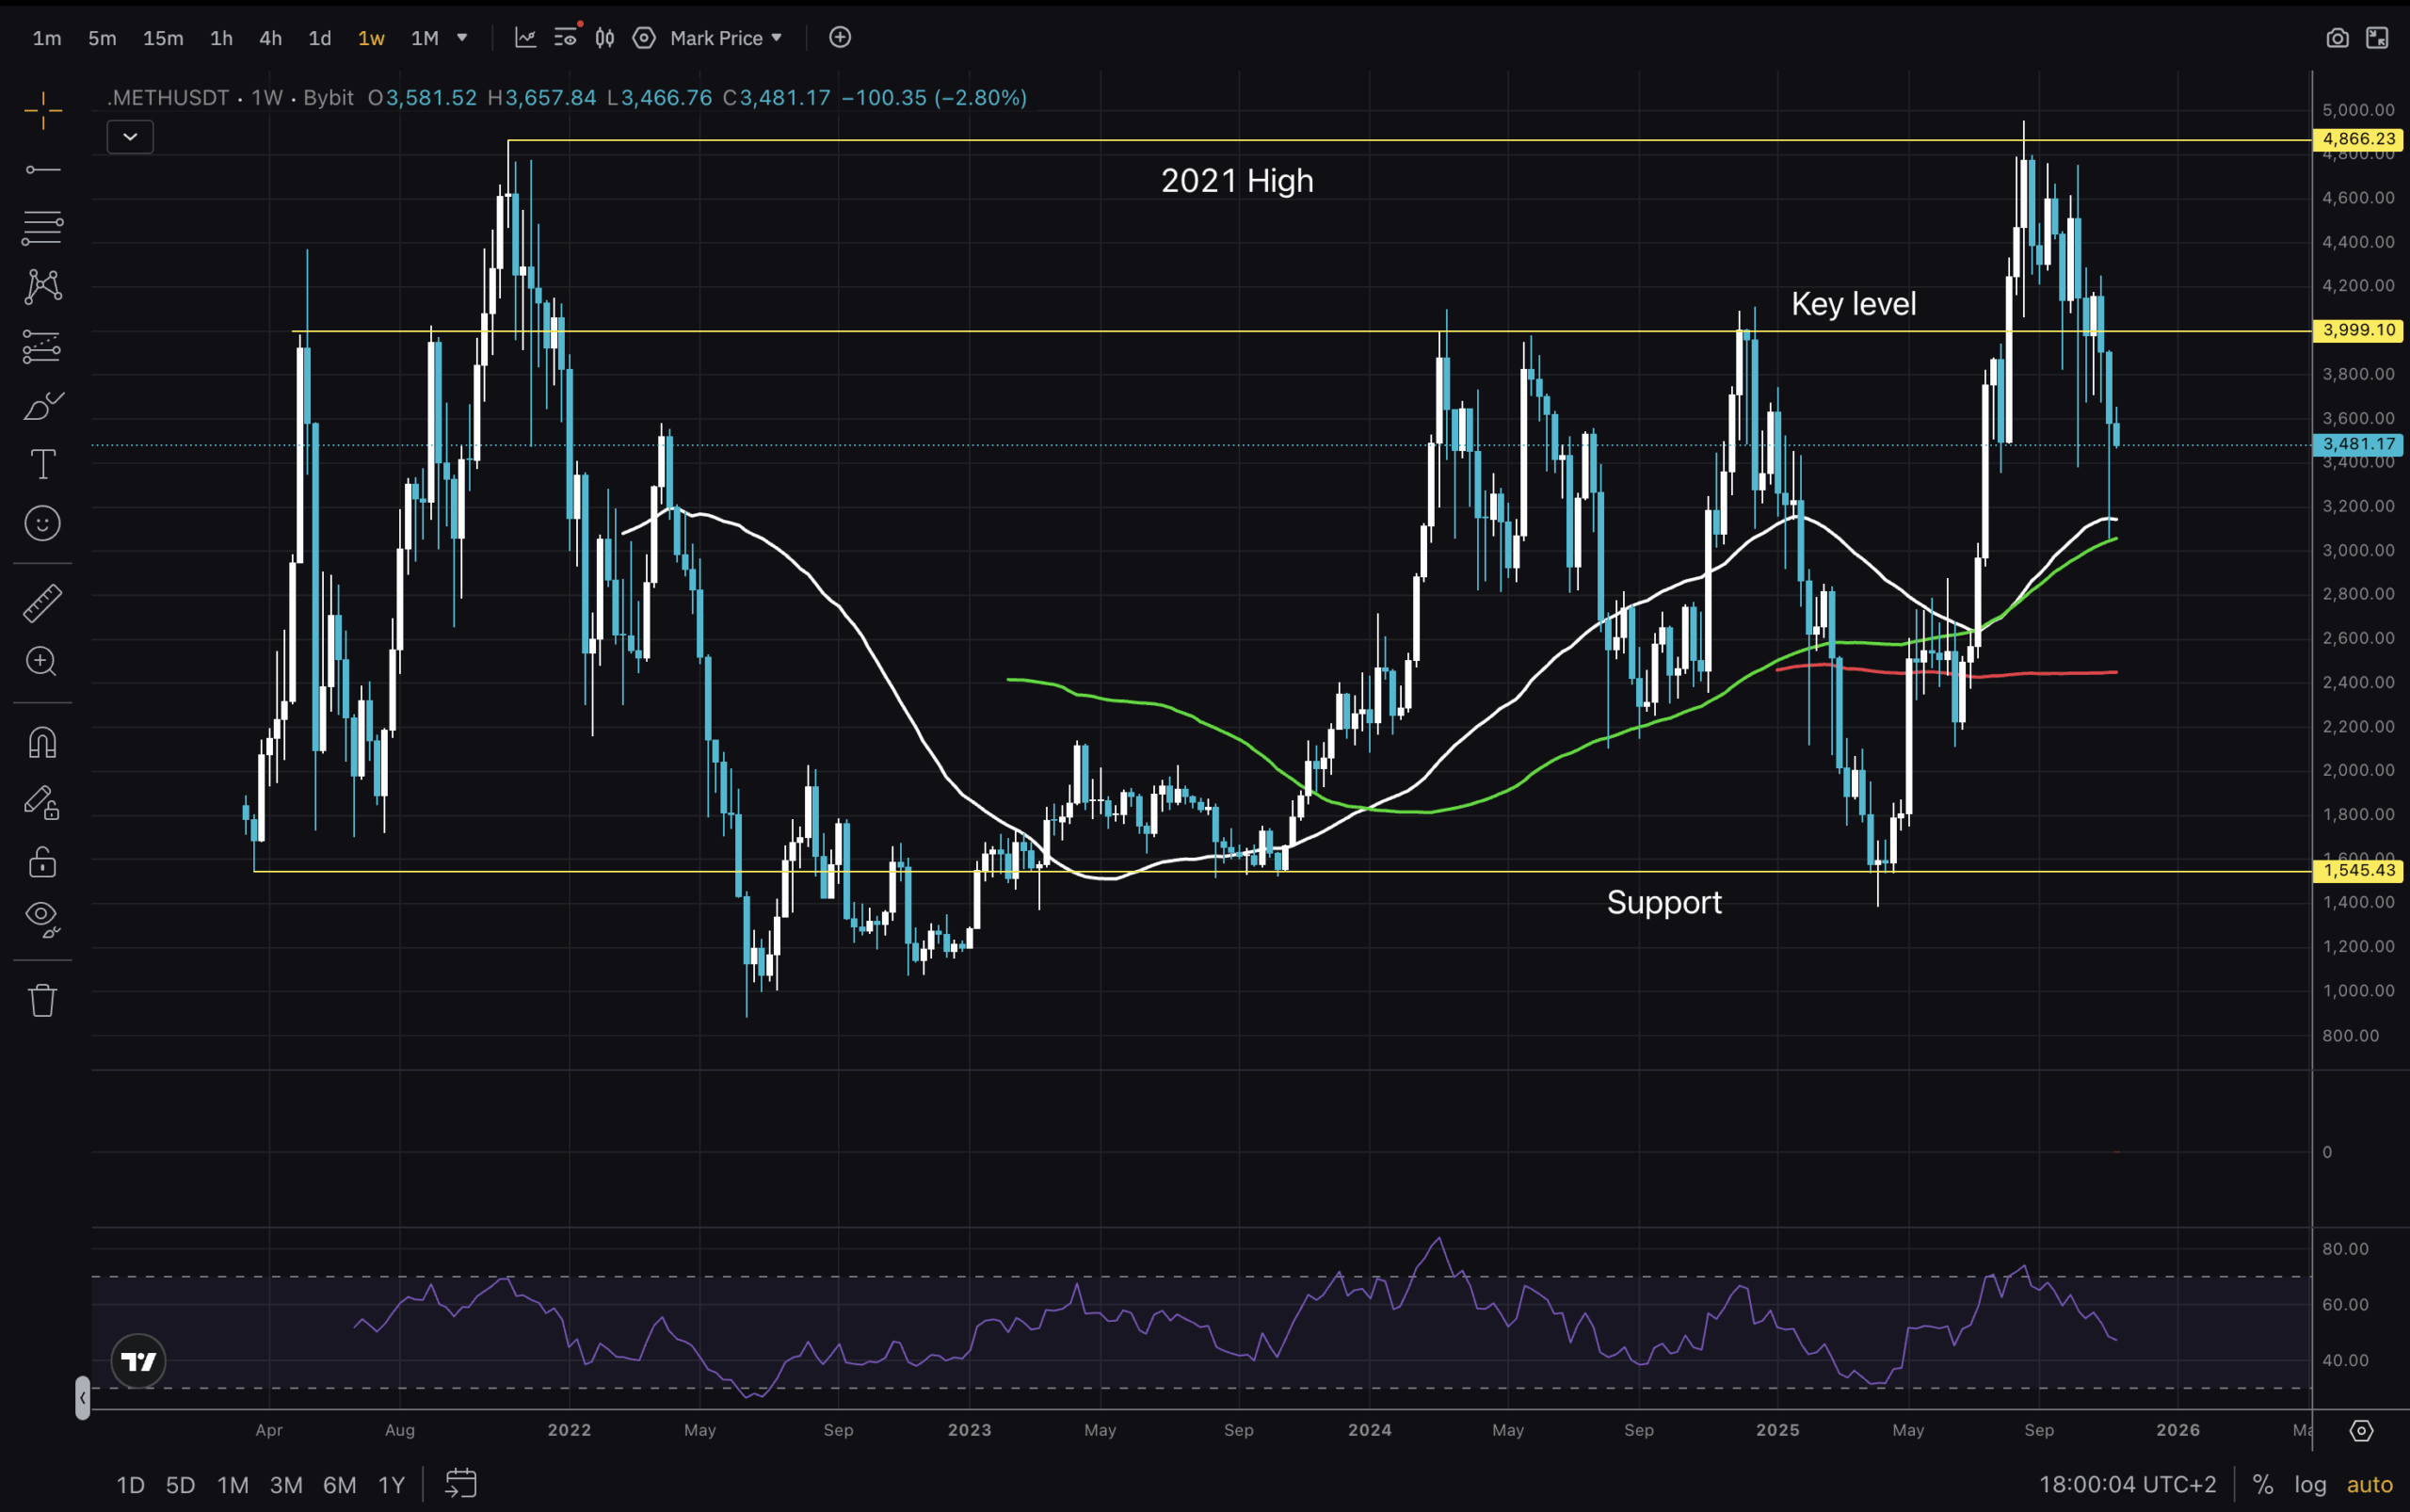
(Source – Tradingview, ETHUSD)
Next, we look at the weekly chart of the ETH USD pair. Price is still in support and the 2021 high, poised to fill this wick. Trading above all moving averages and resetting that RSI are both healthy for the potential next move. We have an MSB as we have a new high after breaking the key $4,000 level. It appears a higher low is in the works.
DISCOVER: 20+ next cryptos that will explode in 2025
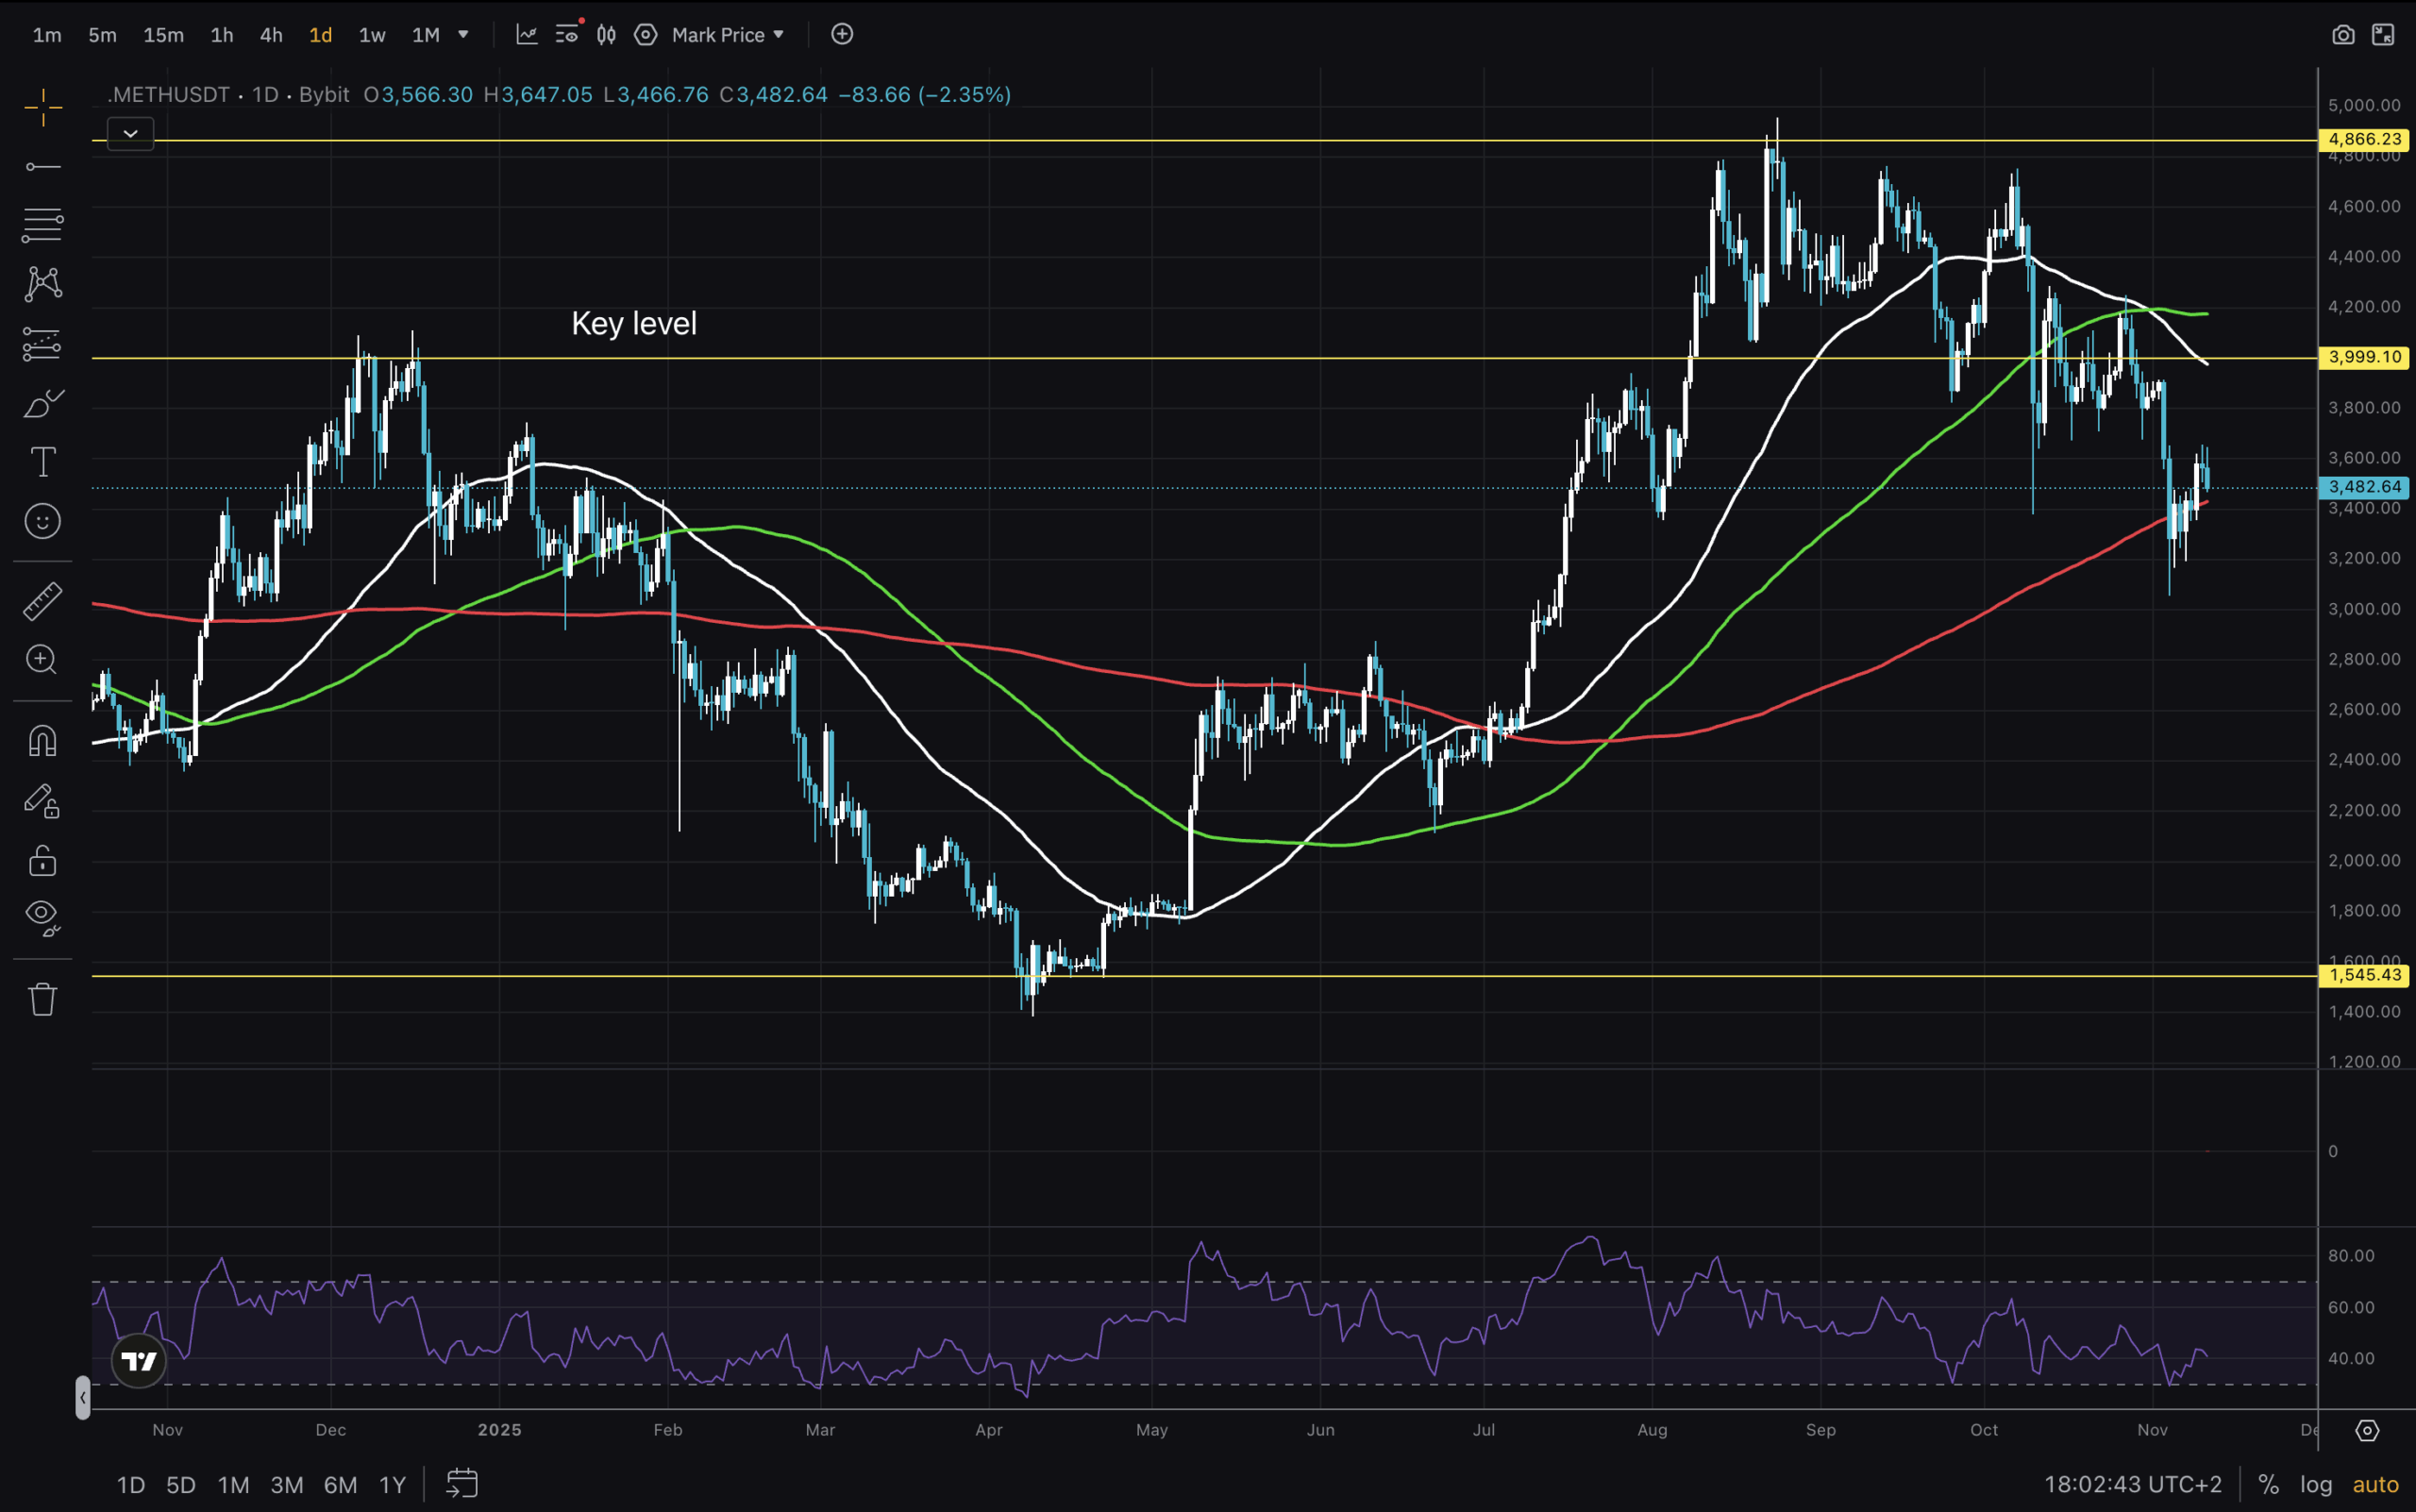 (Source – Tradingview, ETHUSD)
After the weekly, let’s now look at the daily period. Being able to take the total amount from $1,500 to almost $5,000 speaks volumes in itself. A price increase of more than 3 times in 4 months only speaks of demand. The RSI has been trading in the lower half for over a month now, strengthening for a push. We are below the MA50 and MA100, but slightly above the MA200. Will $3,200 be the low, or do we have another drop coming?
DISCOVER: 9+ Best High-Risk, High-Reward Cryptocurrencies to Buy in 2025
Ethereum Price Analysis Conclusions
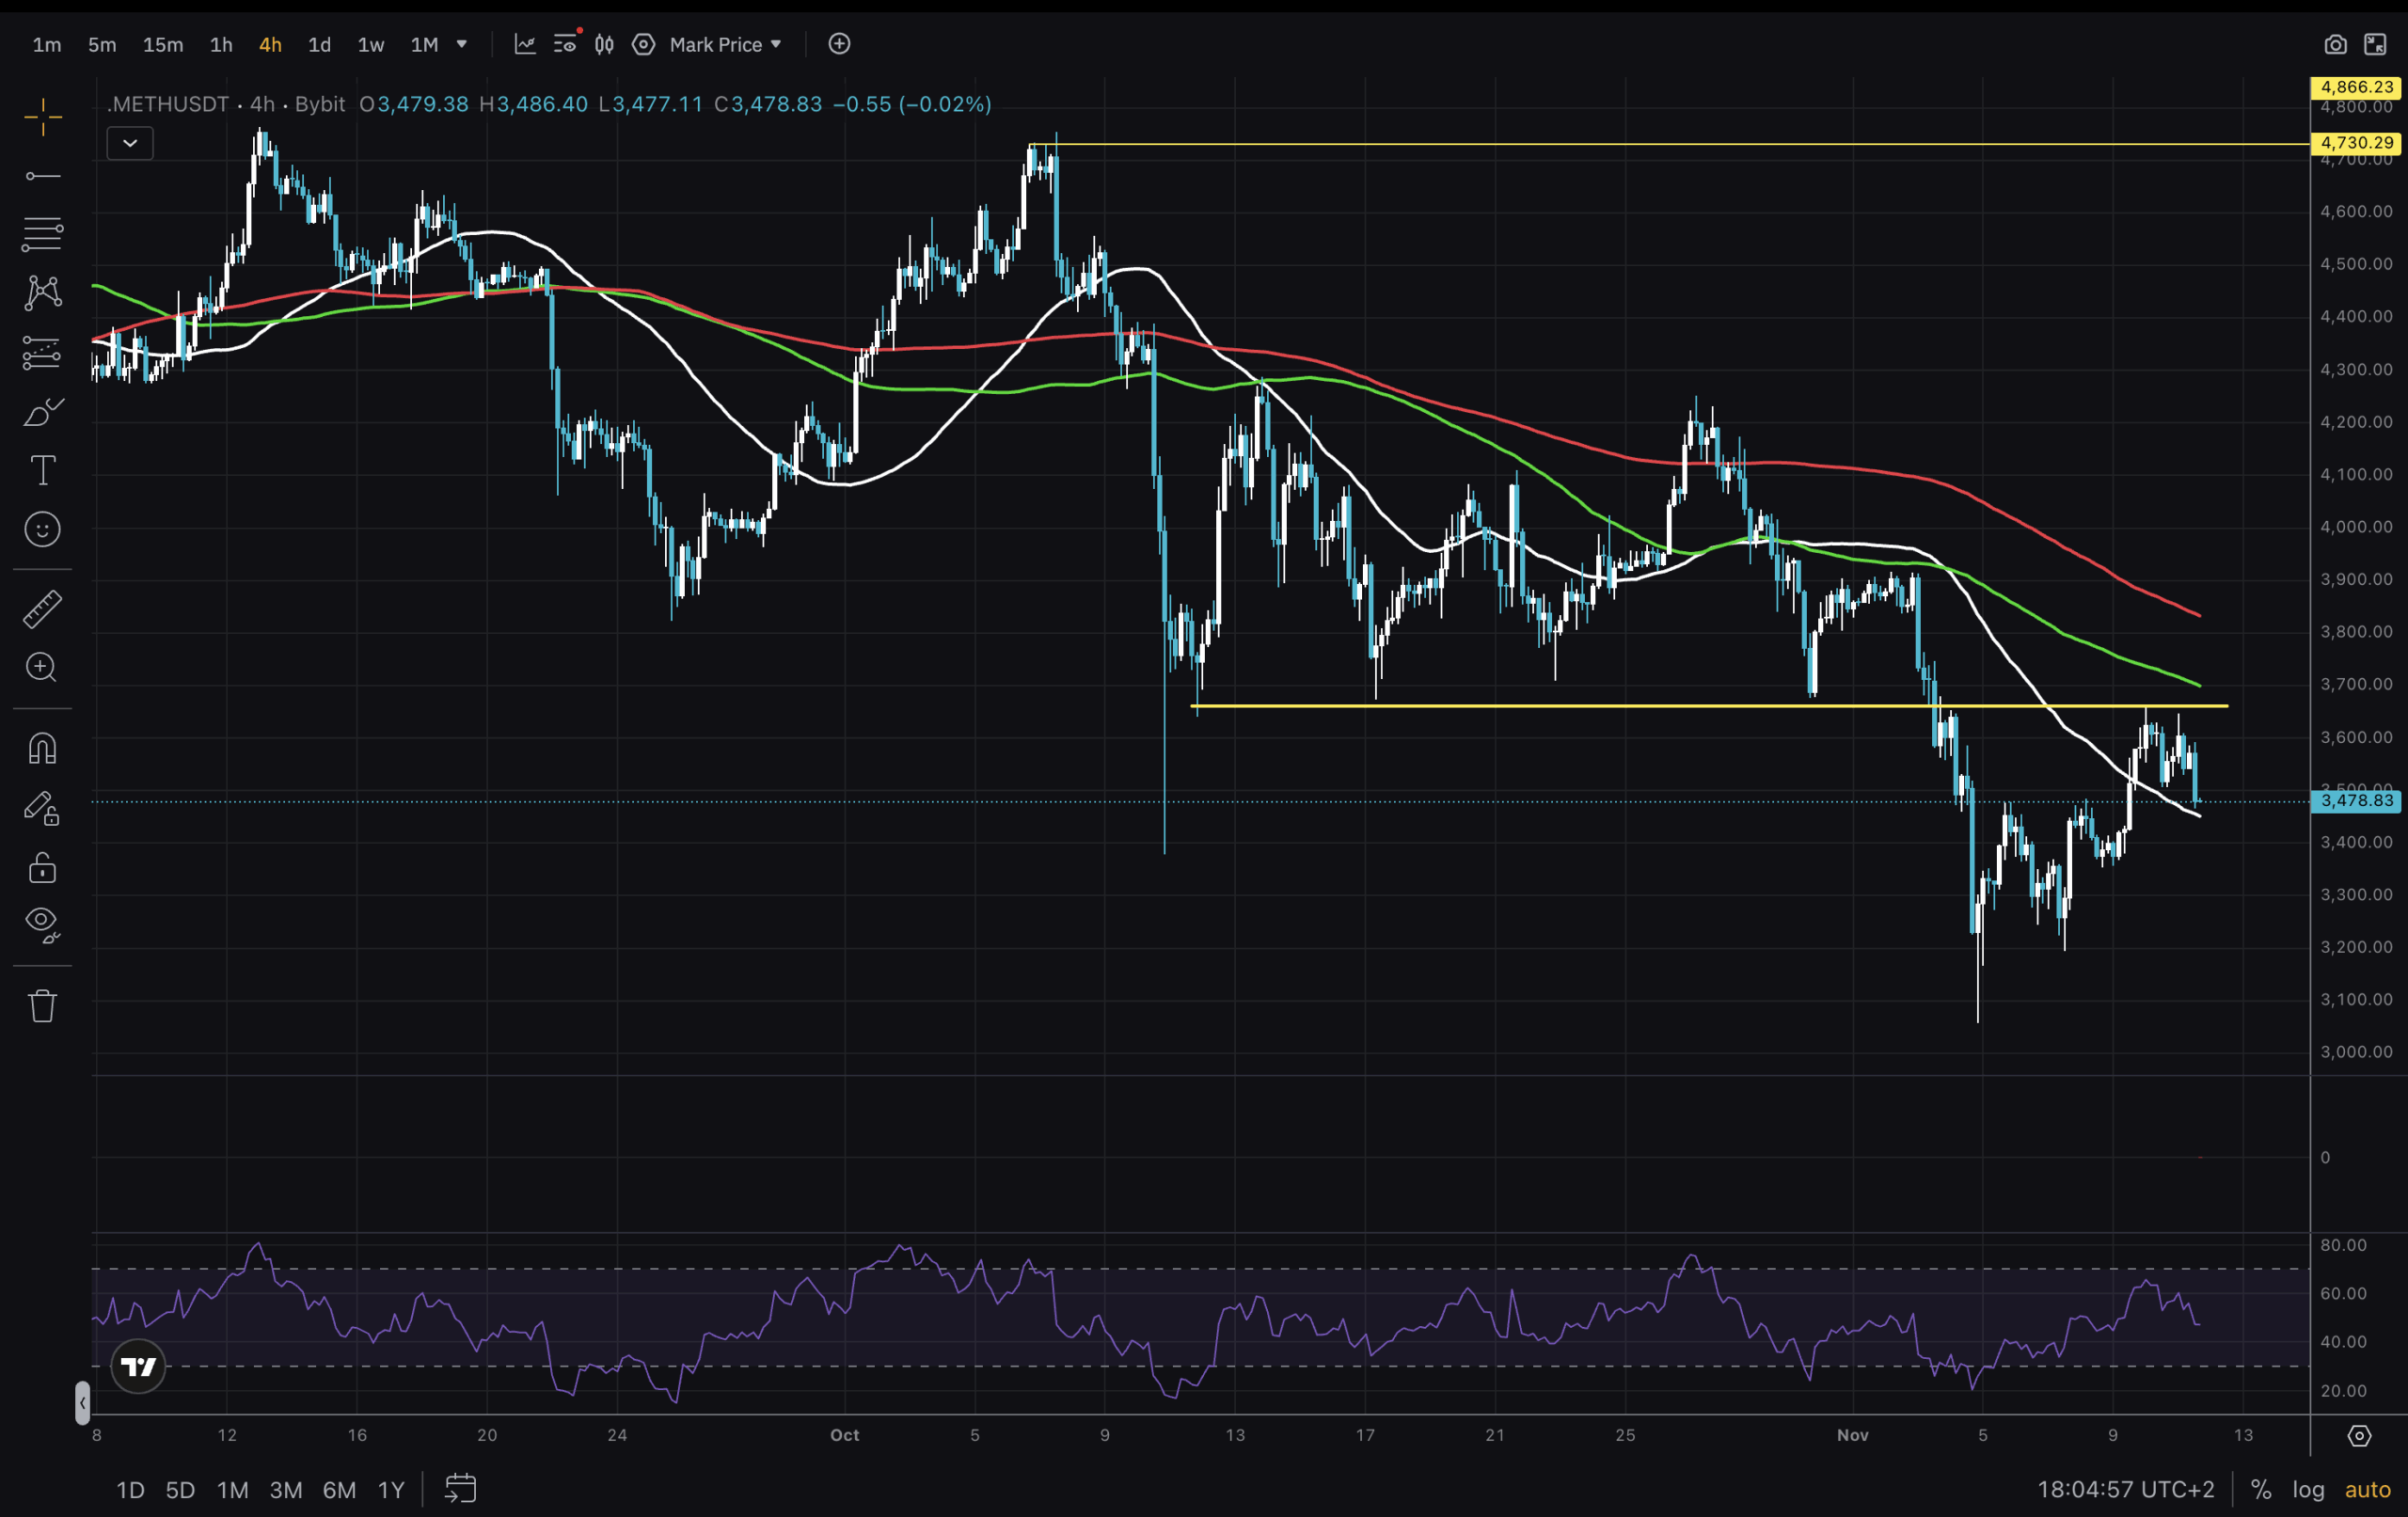
(Source – Tradingview, ETHUSD)
So what do we think of all the information gathered so far? There are some underlying indicators, but nothing is certain until the structure turns bullish. And it will first turn bullish on shorter time frames, like the 4H. Therefore, we look at this chart last. Here we have resistance at $3,650 which rejected our last upside attempt. The RSI is moving back towards the middle and the MAs are on a downward slope. During an uptrend, the MAs are tilted with white at the top. This is what we hope to see in the long term. And this resistance has been recovered. For November to close in green, bulls must act quickly. In the meantime, we only catch knives.
Stay safe out there!
DISCOVER: 9+ Best Memecoin to Buy in 2025
Join the 99Bitcoins News Discord here for the latest market update
ETH USD flirts with a potential bottom: will November print?
-
Nice 1W chart with bullish MAs. We must find the 2024 peak.
-
RSI Levels Allow Price Growth
-
Price must first recover $3,650 and all MAs over 4H
-
There are still buyers and the channel has increased usage – good fundamentals.
The post ETH USD flirting with a potential bottom: will November be printed? appeared first on 99Bitcoins.