


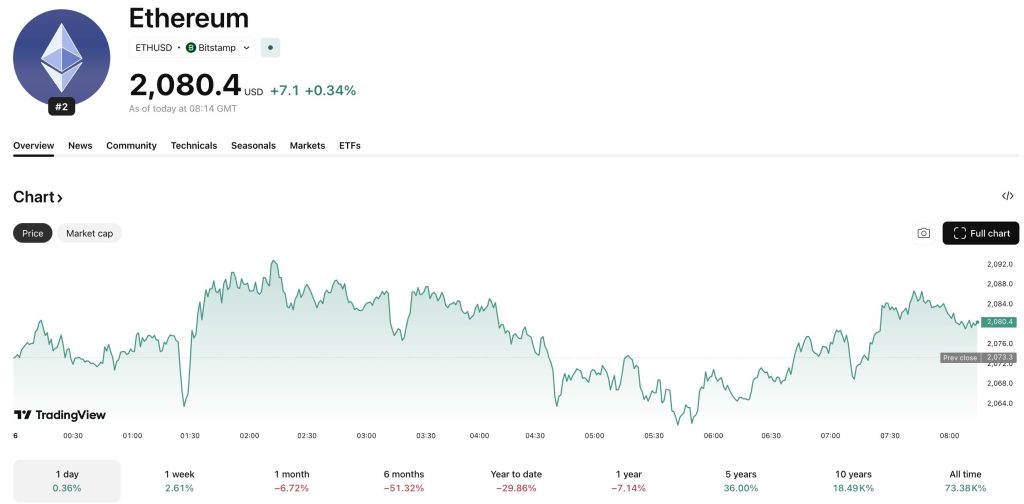
Ethereum price reached the critical resistance level of $2,160 yesterday, and after attempting to reverse a historic six-month losing streak, ETH USD appears to have rejected and is now trading below $2,100.
Price action is currently extremely volatile, with ETH falling -1.6% in the past 24 hours to trade near $2,080, leaving traders paralyzed between a potential breakout and a classic bull trap.
As bullish momentum builds on shorter time frames, many European trading desks are warning of a classic bull trap setup, a counterfeit that attracts buyers before sending the price tumbling to new lows.
With the asset at a turning point, next weekend could set the Ethereum trend for the remainder of the first quarter of 2026.
Ethereum Price Analysis: What’s Next After $2,160 Rejection?
As the 12-hour time frame hints at a massive reversal pattern that has bulls salivating, Ethereum needs to hold above $2,000. A daily close above this level would confirm the inverse head and shoulders trend, with the neckline firmly seated at this crucial $2,160 level.
Adding to this bullish scenario is a clear divergence in the Relative Strength Index (RSI), which made higher lows as the price consolidated. This change in dynamics suggests that sellers are eventually burning out.
If buyers manage to defend the $2,000 area and break through the $2,160 resistance level, the immediate path of least resistance will reverse higher, targeting the 200-day moving average.
However, the risk of counterfeiting remains high. If ETH USD fails to clear this breakout and falls back below $2,000, the bullish structure would be invalidated.
In this scenario, the price would likely retest the $1,900 support zone. Traders monitoring cryptocurrency price predictions today are keenly aware that volume needs to maintain this move, as a breakout on low volume is an ideal candidate for a reversal.
Discover: The best crypto to diversify your portfolio
On-Chain Data Shows Massive ETH USD Accumulation: Is It Enough?
On-chain metrics reveal aggressive accumulation despite chart resistance. Data from Glassnode shows that long-term holders added 252,142 Ethereum to their holdings in February 2026.
This “averaging down” behavior indicates that investors view current prices as a buying opportunity, regardless of short-term volatility.
This accumulation trend coincides with Vitalik’s updates to Ethereum’s long-term roadmap, boosting institutional investor confidence.
The disparity between increasing holder balances and stagnating prices often signals a potential supply shock, assuming macroeconomic conditions do not lead to a liquidation.
Currently, support levels are holding, with the price realized for short-term holders aligning with market prices, suggesting that the capitulation phase may soon end.
Analysts warn: is this a bull trap?
$ETH update
Price near a key resistance level. Looking for a possible liquidity sweep before a bearish move. pic.twitter.com/TYkKM0k0oQ
— Mona Lisa’s jobs
(@TradeX636) March 6, 2026
 (@TradeX636)
 Despite some market optimism, analysts highlight significant structural risks over the weekly period.
Benjamin Cowen points out that Ethereum is trading below its weekly “bull market support band” and that the 50- and 200-week moving averages are near a death crossover.
This has caused seasoned traders to worry that the current rally may be a “bull trap.” If resistance at $2,160 holds, analysts predict a potential decline to between $1,320 and $1,345, a level not seen since the early accumulation phases of the last cycle.
Additionally, a new Chinese AI, Kimi, predicts volatile market conditions through 2026 before sustained all-time highs can occur.
To counter this bearish outlook, bulls need a weekly close above $2,300 on ETH USD to regain structural support; without this, the macro trend remains bearish.
Discover: The most popular meme coins in crypto
The post ETH USD: Is the Ethereum breakout a bull trap? appeared first on Cryptonews.