


According to market charts and comments from renowned traders, XRP’s price action is attracting new attention as some investors say it could challenge Ethereum’s place in the rankings.
Related reading
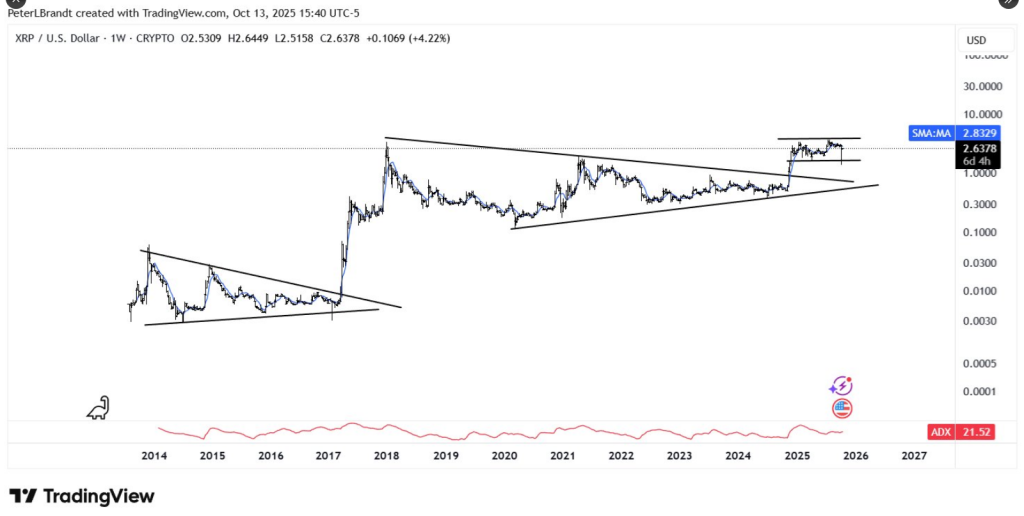
A decade-long chart was shared, tracing movements from 2013 to 2025, and one commenter went so far as to call the next step a potential “Ethereum killer.” This claim has reignited debate in crypto circles.
Technical models Signal repetitions
Crypto analyst Peter Brandt pointed out a set of repeating patterns on the XRP chart: symmetrical triangles and long consolidations that ended in sharp rallies.
The timeline covers a decade and is broken down into three phases. The first period, from 2013 to 2017, ended with a disproportionate increase exceeding 70,000%.
The second phase, extending from approximately 2018 to 2024, produced a downward formation and then a dramatic breakout towards the end of 2024, when price gains were approximately 600%.
Now, the price is held in a tight range after a recent rejection at $3.66, with traders monitoring a band between $2.60 and $2.80 for signs of movement.
Community voice meets difficult math
Another crypto expert, Alex Cobb, comments that the next step could topple Ethereum, which has attracted attention on social media.
“XRP’s next step will be the Ethereum killer,” he said.
XRP’s next step will be the Ethereum killer
-Cobb (@Cobb_XRPL) October 13, 2025
But market data shows a significant gap. XRP’s market cap stands at nearly $147 billion, while Ethereum’s is around $480 billion.
At the current XRP price of $2.49, a rise of over 230% would be required for XRP to break above $8 and surpass Ethereum, assuming ETH remains stable.
This path becomes steeper if Ether rallies again; in August, it hit an all-time high of $4,950, after soaring 239% from April’s low of $1,385.
The market capitalization gap remains significant
The story makes headlines, but it doesn’t prove that the patterns will repeat themselves. XRP actually briefly became the second largest cryptocurrency in 2018, fueling today’s hopes.
Nonetheless, some technical analysts have publicly toned down earlier bullish calls, urging caution and recommending investors hold on to both tokens rather than expecting a reversal.
Market behavior is shaped by many moving parts – financial flows, macroeconomic events and network updates – none of which are guaranteed to follow past scripts.
Related reading
Feeling and structure
Social momentum can cause prices to rise quickly, and chart breakouts can trigger big moves when liquidity is low. At the same time, market capitalizations are determined by supply and demand on many exchanges and large holders.
A trend that appears clear on a long-term chart may be interrupted by regulatory headlines, a change in investor appetite, or simply by a stronger rally in the rival asset.
Featured image from PBR Australia, chart from TradingView