


- Ethereum ETFs saw a record weekly inflow of $515 million.
- Meanwhile, ETH is down 1.85% over the past week.
Since the approval of Ethereum (ETH) ETFs in July, the market has struggled to see sustained inflows. However, over the past couple of weeks, Ethereum ETFs have seen increased interest.
One of the main reasons for this was the continued influx of institutional investors in anticipation of an uptrend.
Spot Ethereum ETFs see inflows
According to Sosovalue analysis by AMBCrypto, Ethereum ETFs saw a massive inflow between November 9 and 15. During this period, ETH ETFs saw a record inflow of $515.17 million.
Source: Sosovalue
This level currently occurs following a sustained positive inflow over three weeks. Although the weekly inflow was a notable record, November 11 saw the largest daily inflow, reaching a peak of $295.4 million.
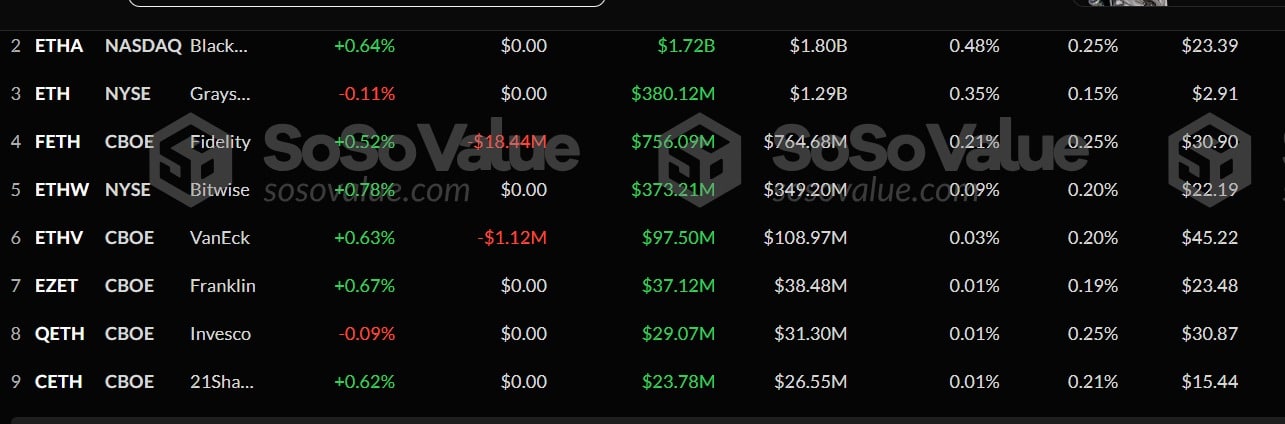
Amidst this, Blackrock ETHA saw the highest total inflow of $287 million, bringing its total to $1.7 billion.
In second place is Fidelity’s FETH, which saw its market reach $755.9 million with an inflow of $197 million over this period.
Meanwhile, Grayscale’s ETH inflow reached $78 million, while Bitwise’s inflow stood at $54 million.
These stocks were the biggest gainers during this period, while others, like ETHV and 21 Shares, saw moderate inflows. With these increased inflows, Ethereum ETFs stood at $9.15 billion.
Implication on the ETH price chart
Although such an influx should have a positive impact on the ETH price chart, that is not the case this time. During this period, ETH fell from a high of $3,446 to a low of $3,012.
Even on November 11, when the inflow was greatest on the daily charts, ETH declined.
This trend persisted even as of this writing. In fact, at press time, Ethereum was trading at $3,122, marking moderate declines on the daily and weekly charts, dropping 1.22% and 1.85%, respectively.
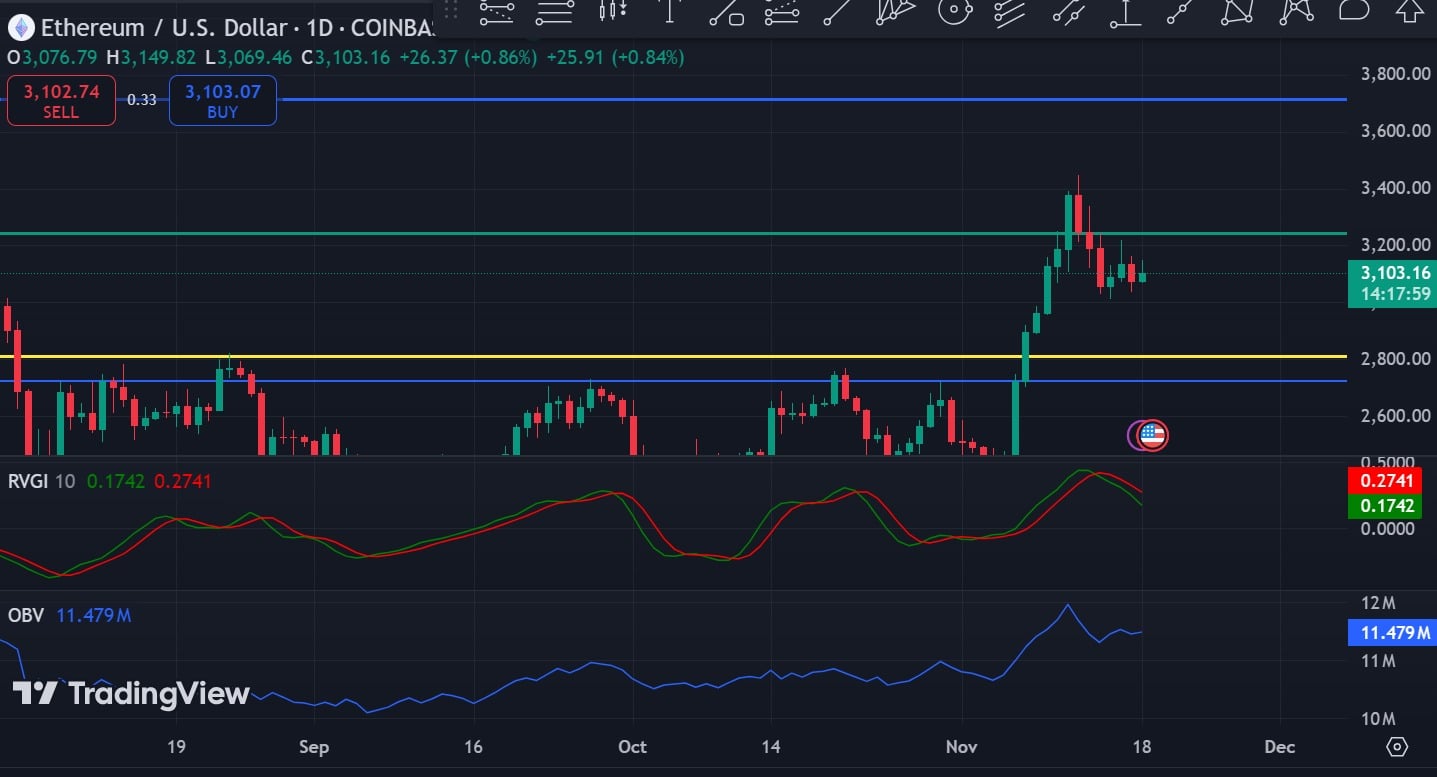
Source: TradingView
These market conditions suggest that ETH was struggling with bearish sentiment in a bull market.
This market behavior was highlighted by the fact that ETH’s RVGI line made a bearish crossover to fall below its signal line. This suggests that the bullish momentum is weakening, signaling a potential trend reversal.
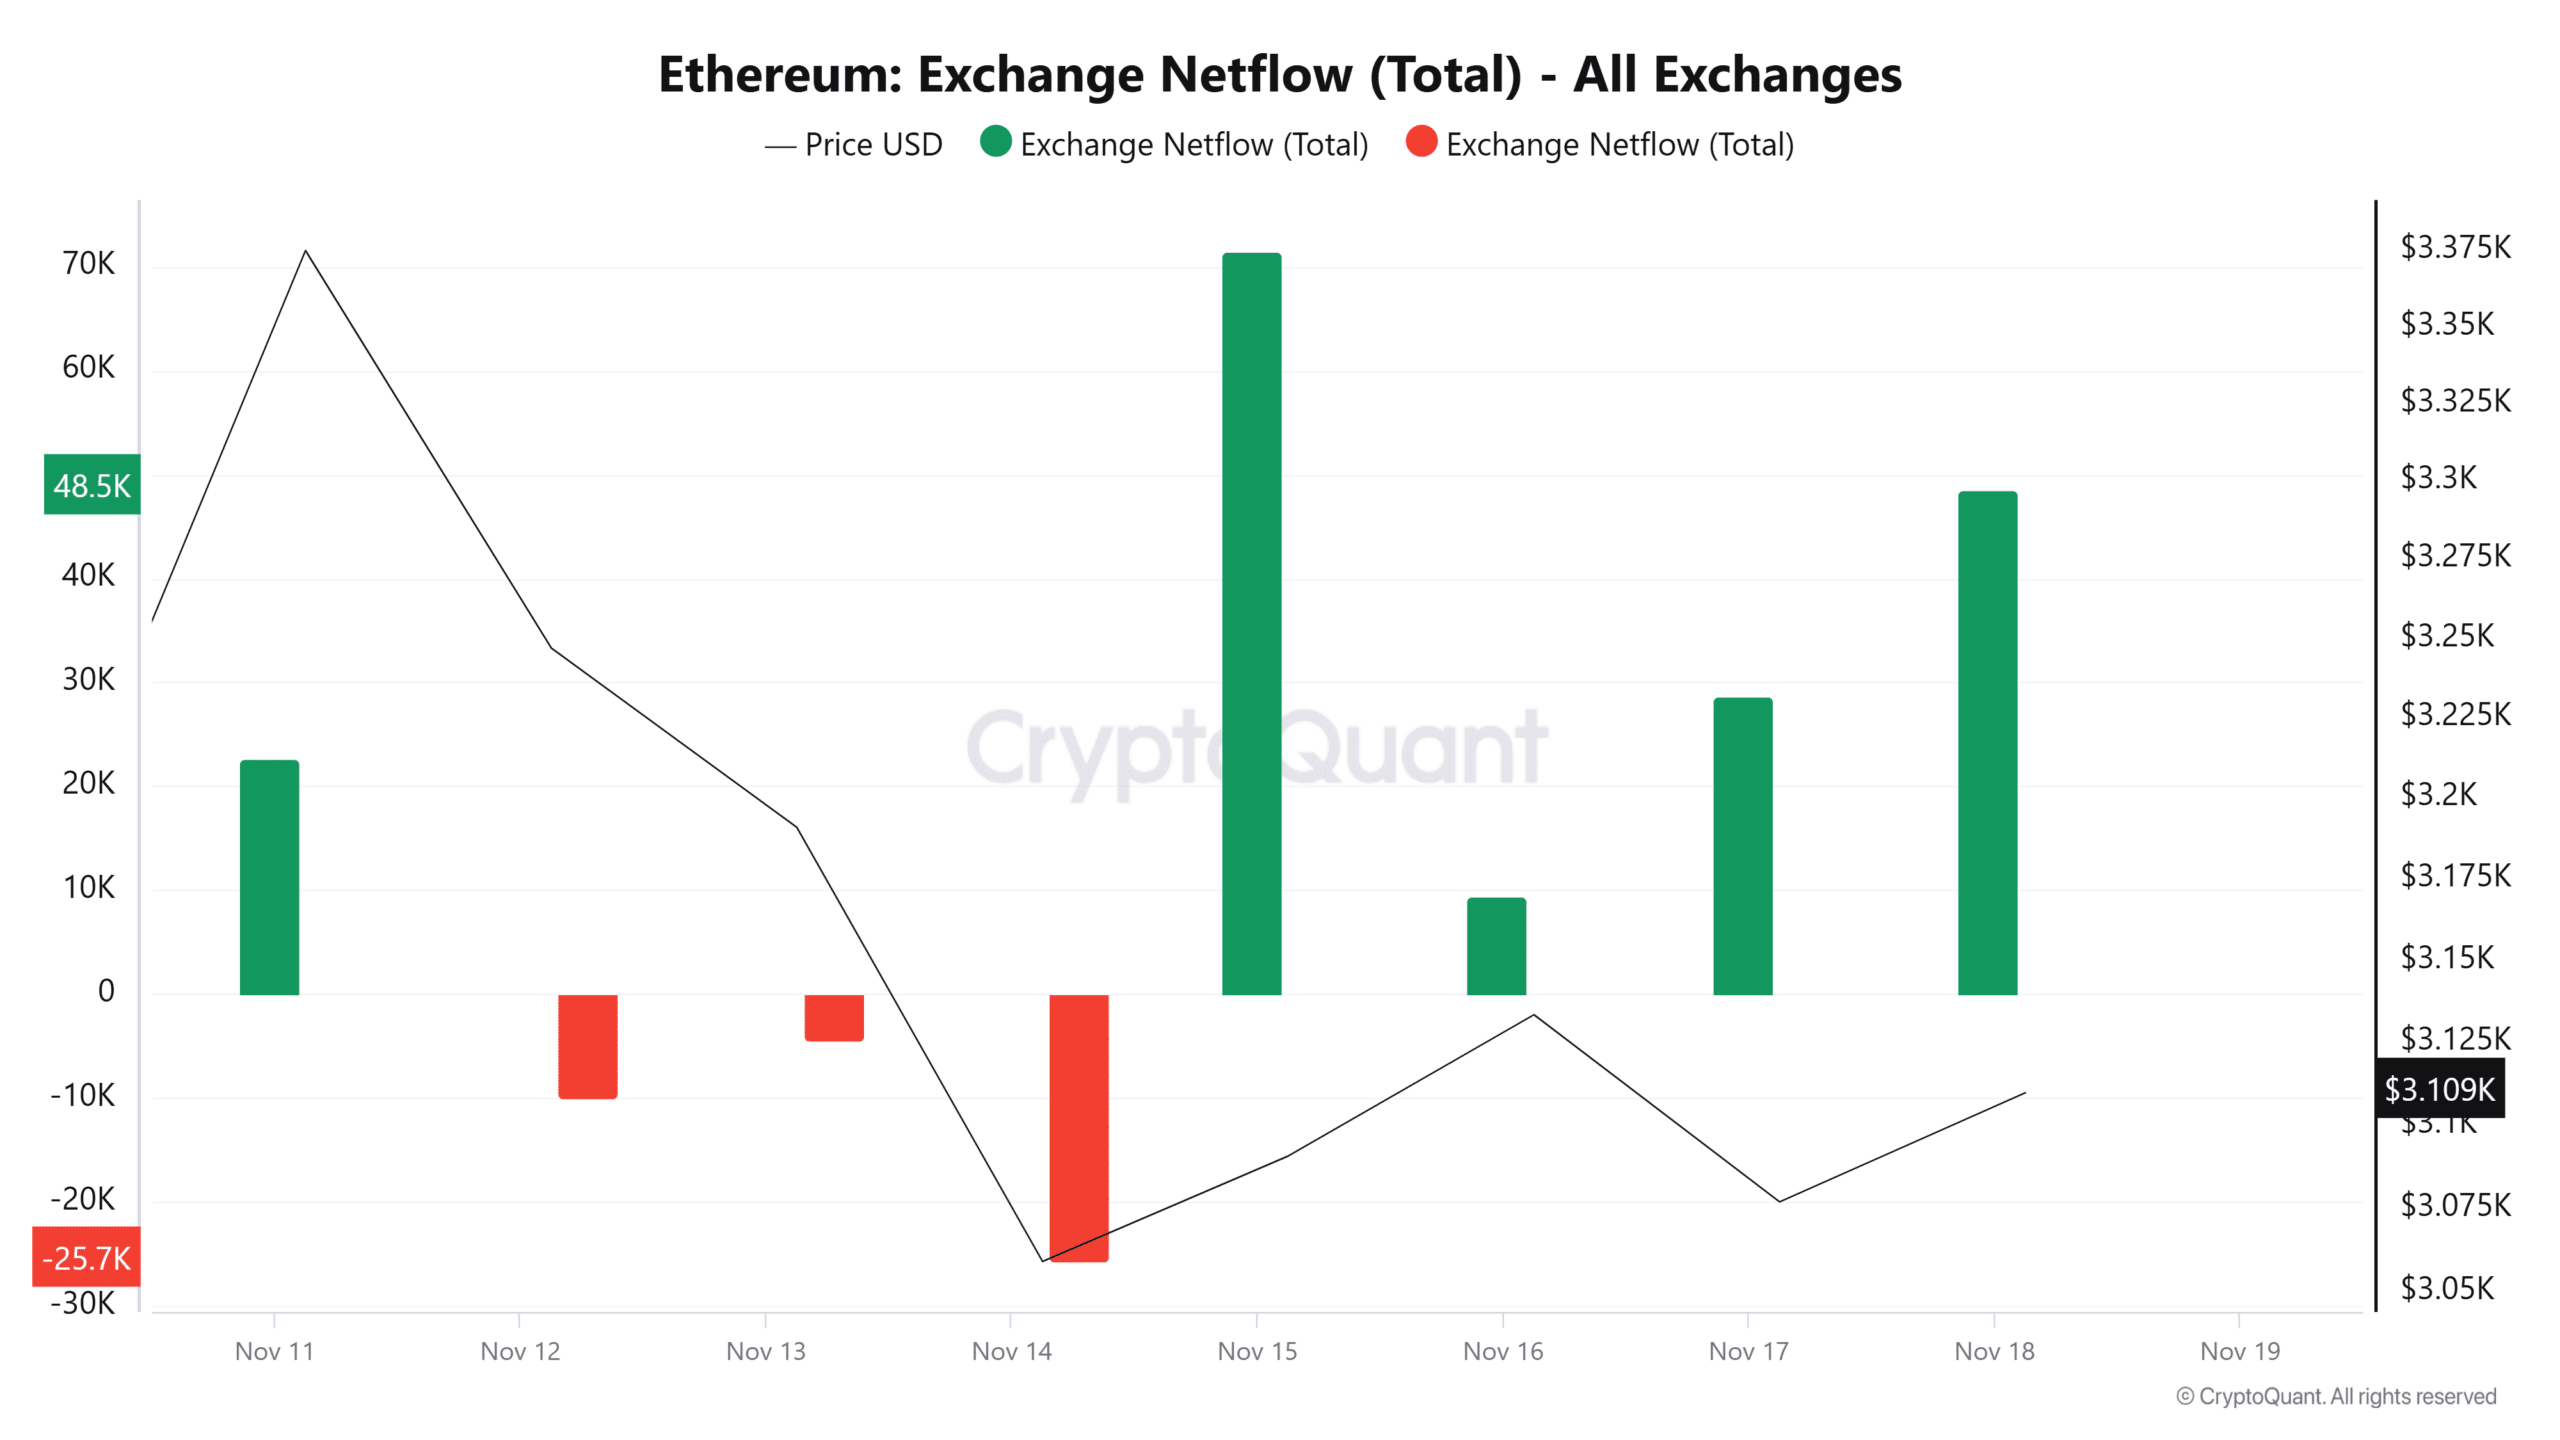
Source: CryptoQuant
Additionally, Ethereum’s net flow has remained positive over the past four days, implying that there have been more inflows into exchanges than outflows. Episodes like this suggest that investors lacked confidence.
Although Ethereum ETFs have seen record inflows, this has yet to have a positive impact on the ETH price charts. On the contrary, the altcoin declined during this period.
Read Ethereum (ETH) Price Forecast 2024-2025
Current market conditions suggest a potential pullback. If this happens, ETH will find support around $3,000.
However, as the crypto market is still in an uptrend if bulls regain control, ETH will reclaim the $3,200 resistance in the near term.