


Ethereum (ETH USD) price has fallen below the psychologically key $3,000 level, with Ethereum price action now hovering in a fragile consolidation zone following a strong sell-off. At the time of writing, ETH is trading between $2,900 and $2,950, down approximately 5-7% over 24 hours, while its market cap has slipped towards the mid-$340 billion range.
The move comes as nearly $600 million in leveraged crypto positions were liquidated in a single day and traders brace for a potential volatility spike due to weak technicals and mixed institutional flows.
FAM GM
Yesterday we saw $BTC falling below 86,000, triggering more than $600 million in liquidations. The key factor was risk reduction ahead of the Bank of Japan’s interest rate decision.
We are now in extreme fear, this is where we slow down and analyze.
Some reminders:
– Avoid multiple vacancies… pic.twitter.com/Ac3ysOjsLe– Kapoor Kshitiz (@kshitizkapoor_) December 16, 2025

Why did Ethereum price suddenly fall below $3,000?
For new readers, Ethereum is the second largest crypto network by market capitalization and the backbone of DeFi, NFTs and most tokenization projects; When ETH breaks key price levels, it tends to ripple throughout the market.
According to Economic TimesEthereum price fell approximately -6.9% to around $2,904 in a large liquidation event that wiped out around $592 million in crypto leverage. This drop extended an already fragile structure that began in November, when Ether lost support at $3,590 on 138% above-average selling volume, as reported CoinDesk.
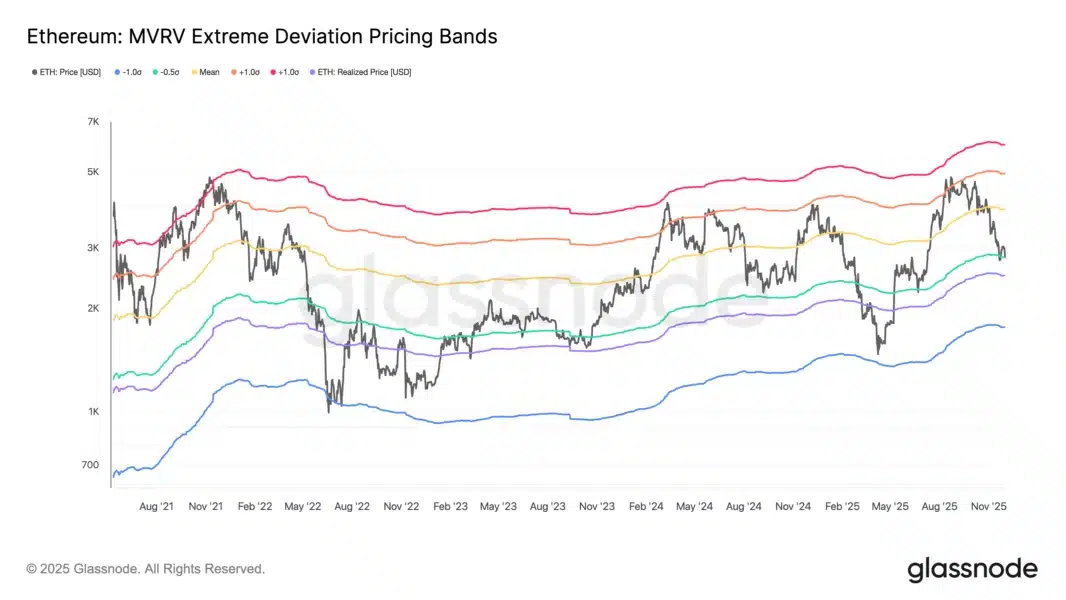
Short-term traders are closely watching the $2,820-$2,830 area, where the MVRV deviation bands have repeatedly acted as a sort of on-chain shock absorber.
Since 2016, the best times to accumulate Ethereum $ETH occurred when the MVRV Z-Score drops below 0.
It is now at 0.29. pic.twitter.com/HVyGxE8bQF
– Ali Charts (@alicharts) November 26, 2025
Cointelegraph notes that this band has been a recurring rebound zone over the past few weeks, suggesting that some participants still see value accumulation there, even as overall sentiment turns cautious. On the intraday chart, Ethereum price is currently trading below $3,000 and its 100 hourly simple moving average, with a clear downtrend line capping recovery attempts near $3,120.
(Source – TradingView, CoinTelegraph)
This doesn’t happen in a vacuum. Bitcoin’s own pullback and liquidations relied on Ethereum’s correlations, a theme we followed in earlier coverage of BTC wipeouts and Ethereum and institutional demand. At the same time, growing competition from altchains like Solana and growing narratives around rival smart contract ecosystems divert some speculative capital away from ETH during periods of risk aversion.
DISCOVER: 15+ Upcoming Coinbase Listings to Watch in 2025
How might this Ethereum price distribution shape market volatility and structure?
The immediate question for traders is whether this sub-$3,000 range becomes a springboard or a trap. Technically, resistance now lies around $2,980, $3,050, then $3,080 to $3,120; a decisive move above this band could pave the way for a return towards $3,175 to $3,200.
But the failure to reclaim $2,980 and $3,000 with volume leaves ETH vulnerable to a decline towards $2,920 and potentially between $2,880 and $2,840, with $2,800 appearing as a critical decline line in the sand.
Structurally, this pullback highlights how Ethereum remains heavily dependent on leveraged futures flows and macroeconomic risk appetite. U.S.-traded ETH ETFs saw outflows of approximately $578 million in August 2025, indicating that some institutions tactically reduced their exposure, according to Invest.
Yet at the same time, the launch of JPMorgan’s MONY tokenized money fund on Ethereum highlights that blue-chip institutions continue to thrive on the network even as prices falter, as reported Business Insider.
Competitively, liquidity is fragmenting. Some capital has flowed into narratives and faster-moving altcoins, as we discussed in our coverage of altseason and ETH configurations and wider Bitcoin and Ethereum Price Predictions Subject to Growing Risk.
If ETH fails to defend its current on-chain support zones, the narrative that “Ethereum is the safe large cap in DeFi” could temporarily weaken, giving more leeway for rivals to present themselves as higher beta plays.
DISCOVER: 16+ New and Upcoming Binance Listings in 2025
What are the real risks for Ethereum traders right now?
The main risk is assuming that a break below $3,000 automatically guarantees a quick turnaround. Hourly indicators remain bearish: the MACD on ETH/USD continues to gain momentum in the red and the RSI sits below 50, reflecting seller control rather than capitulation exhaustion.
With liquidations already high, a second wave of forced selling could occur if the price loses the supports at $2,920 to $2,880.
There is also narrative risk: Ethereum’s on-chain metrics still show strong usage and institutional experimentation, but the price sends a more cautious message. Recent coverage on “ETH’s worst bull runs” and competitive threats, like our article on Ripple targets Ethereum marketcan amplify fear when technical parameters are already low.
It is crucial for investors to distinguish price fluctuations caused by leverage from long-term structural health to decide whether it is a buying opportunity or a signal to reduce risk.
For now, volatility risk cuts both ways. A clear recovery and holding above $3,080 to $3,120 would suggest the current move was leverage into a wider range, while a daily close below $2,880 would strengthen the case for a deeper correction.
Until the chart makes this choice, disciplined position sizing, clear invalidation levels, and an honest view of your time horizon matter more than trying to determine the exact bottom.
DISCOVER: Top 20 cryptocurrencies to buy in 2025
Join the 99Bitcoins News Discord here for the latest market updates
The post Ethereum Falls Below $3,000 as Liquidations, Volatility Looms appeared first on 99Bitcoins.