Close Menu
Altcoin ObserverAltcoin Observer
  • Regulation
  • Bitcoin
  • Altcoins
  • Market
  • Analysis
  • DeFi
  • Security
  • Ethereum
Categories
  • Altcoins (2,593)
  • Analysis (2,741)
  • Bitcoin (3,349)
  • Blockchain (2,041)
  • DeFi (2,458)
  • Ethereum (2,335)
  • Event (94)
  • Exclusive Deep Dive (1)
  • Landscape Ads (2)
  • Market (2,520)
  • Press Releases (10)
  • Reddit (2,020)
  • Regulation (2,339)
  • Security (3,218)
  • Thought Leadership (3)
  • Videos (43)
Hand picked
  • Crypto scammers swindle elderly couple out of $1.3 million retirement
  • NFT market capitalization exceeds +$3.3 billion
  • Trump’s World Liberty Financial Launches Crypto Loans as USD1 Stablecoin Hits $3.5 Billion
  • CLARITY Act Delayed as Senate Struggles to Get Votes
  • BlockDAG final presale phase begins with 312,000 holders! SUI Weakens and Binance Coins Slip
We are social
  • Facebook
  • Twitter
  • Instagram
  • YouTube
Facebook X (Twitter) Instagram
  • About us
  • Disclaimer
  • Terms of service
  • Privacy policy
  • Contact us
Facebook X (Twitter) Instagram YouTube LinkedIn
Altcoin ObserverAltcoin Observer
  • Regulation
  • Bitcoin
  • Altcoins
  • Market
  • Analysis
  • DeFi
  • Security
  • Ethereum
Events
Altcoin ObserverAltcoin Observer
Home»Ethereum»Ethereum forms a symmetrical one-hour triangle – bullish breakout or deeper correction?
Ethereum

Ethereum forms a symmetrical one-hour triangle – bullish breakout or deeper correction?

January 13, 2025No Comments
Share Facebook Twitter Pinterest LinkedIn Tumblr Reddit Telegram Email
Untitled Design 18.jpg
Share
Facebook Twitter LinkedIn Pinterest Email


This article is also available in Spanish.

Ethereum began the year as it ended the previous one: under a bearish cloud. The altcoin leader has had a rocky start, with its price falling more than 16% since January 6. Price weakness continues to dominate as ETH struggles to find solid support, leaving investors cautious about what lies ahead.

Related reading

Amid market uncertainty, analyst Carl Runefelt shared technical analysis on X, offering insight into Ethereum’s potential next move. Runefelt points out that ETH forms a symmetrical triangle pattern over a one-hour time frame, a pattern that typically precedes a significant price movement. According to his analysis, this formation signals a period of consolidation that could lead to either a bullish breakout or a bearish breakout.

A breakout could bring much-needed optimism to Ethereum investors, potentially reversing the downtrend and pushing the price towards higher levels. On the other hand, an outage could extend ETH’s current losses, raising concerns about deeper corrections in the near term. As the market awaits clarity, all eyes are on Ethereum’s next move, which could set the tone for its performance in the weeks to come.

Fight against Ethereum: what’s next for the Altcoin leader?

Ethereum investors face tough times, and price action continues to disappoint. After briefly holding key demand levels, many expected a change in market sentiment. However, ETH has now fallen to its lowest price since late December, leaving investors worried about its next move.

Analyst Carl Runefelt recently shared technical analysis on X, shedding light on Ethereum’s current situation. Runefelt revealed that ETH forms a symmetrical triangular pattern over a one-hour time frame, a structure that suggests a significant price movement is imminent. The model highlights critical levels on both sides of the market, providing a roadmap for potential outcomes.

Ethereum forms a symmetrical triangle 1H | Source: Carl Runefelt on X

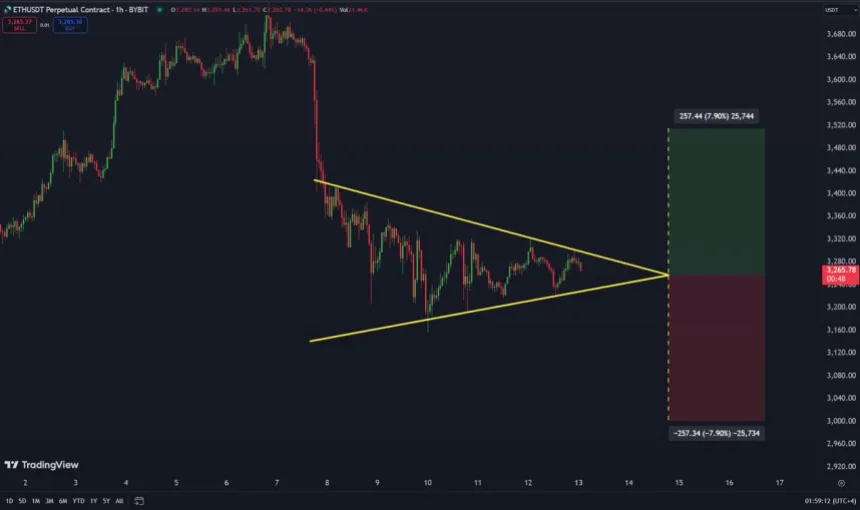
If Ethereum fails to sustain above the $3,000 level, a deeper correction is likely, which could send the price significantly lower. Conversely, regaining the $3,500 level would signal strength, paving the way for a massive breakout. Such a move would not only restore investor confidence but also attract new capital into the market.

Related reading

The market as a whole is at a crossroads, with Bitcoin holding above key support levels while altcoins, including Ethereum, continue to see selling pressure. As traders closely monitor ETH’s next move, its performance in the coming days could set the tone for the broader altcoin market.

ETH Tests Crucial Support Levels Amid Downtrend

Ethereum is trading at $3,113 after a 6% decline over the past few hours, signaling continued bearish pressure in the market. Price is now testing the 200 daily exponential moving average (EMA) at this level, a critical technical indicator that could determine the direction of the next move. Holding this EMA as support could trigger a bullish recovery, giving ETH the momentum needed to regain higher levels in the coming sessions.

Crucial demand for ETH testing | Source: ETHUSDT chart on TradingView

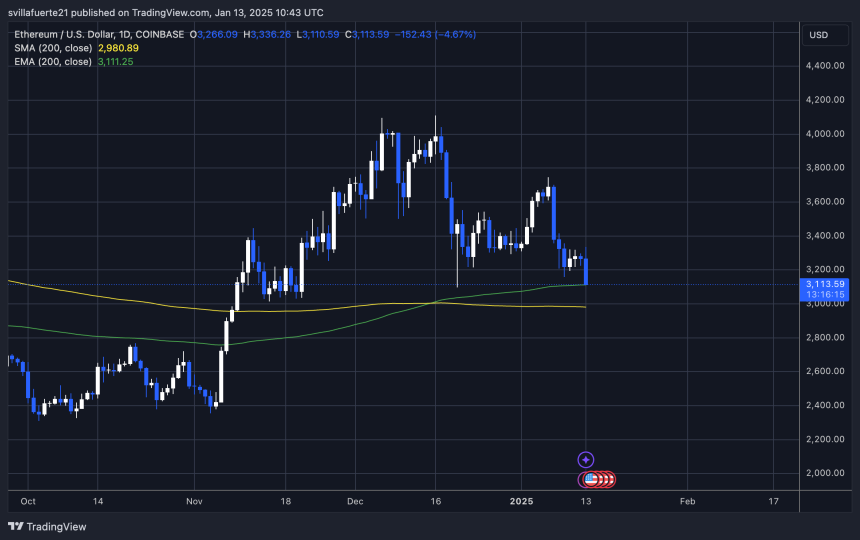
However, the market remains nervous and the key level to watch for support is the untested $3,000 mark. This psychological and technical level has not been revisited since late November, making it an important area of ​​interest for both bulls and bears. A decline to this level could spark strong buying interest, potentially paving the way for a rebound.

Related reading

On the other hand, if ETH fails to hold the daily 200 EMA or loses the $3,000 level, a deeper correction could ensue, potentially driving the price to new lows for 2025 With bearish market sentiment and key supports tested, Ethereum’s price action in the coming days will be crucial in shaping its short-term trend.

Featured image of Dall-E, chart by TradingView


Source link

Share. Facebook Twitter Pinterest LinkedIn Tumblr Email
Previous ArticleCardano Price Prediction for Today, January 13 – InsideBitcoins
Next Article Tokenized assets will double on the provenance blockchain

Related Posts

Ethereum

Ethereum Needs Better Decentralized Stablecoins, Says Buterin

January 13, 2026
Ethereum

Ethereum price collapse could put $800 billion in assets at risk

January 12, 2026
Ethereum

Connecting DeFi and TradFi – Enterprise Ethereum Alliance

January 12, 2026
Add A Comment
Leave A Reply Cancel Reply

Single Page Post
Share
  • Facebook
  • Twitter
  • Instagram
  • YouTube
Featured Content
Event

Black Swan Summit India to Drive the Future of India’s Digital Finance Economy

January 8, 2026

The Black Swan Summit India, held under the theme “Reshaping India’s Digital Finance Economy: Employment,…

Event

WikiEXPO Hong Kong 2026 to Unite Global Fintech, Forex, TradFi, and Crypto Leaders

January 7, 2026

WikiEXPO Hong Kong 2026, Asia’s largest Fintech, Forex, TradFi, and Crypto carnival, will take place on July 23–24,…

1 2 3 … 69 Next
  • Facebook
  • Twitter
  • Instagram
  • YouTube

Trump’s World Liberty Financial Launches Crypto Loans as USD1 Stablecoin Hits $3.5 Billion

January 13, 2026

$1.7 Billion in Token Unlocks Could Spark a Crypto Rally

January 12, 2026

Zcash Soars 9% – But Can Buyers Support ZEC’s Surge?

January 12, 2026
Facebook X (Twitter) Instagram LinkedIn
  • About us
  • Disclaimer
  • Terms of service
  • Privacy policy
  • Contact us
© 2026 Altcoin Observer. all rights reserved by Tech Team.

Type above and press Enter to search. Press Esc to cancel.

bitcoin
Bitcoin (BTC) $ 91,080.00
ethereum
Ethereum (ETH) $ 3,100.48
tether
Tether (USDT) $ 0.998831
xrp
XRP (XRP) $ 2.05
bnb
BNB (BNB) $ 904.04
solana
Solana (SOL) $ 138.28
usd-coin
USDC (USDC) $ 0.999698
tron
TRON (TRX) $ 0.298687
staked-ether
Lido Staked Ether (STETH) $ 3,099.56
dogecoin
Dogecoin (DOGE) $ 0.136706