Close Menu
Altcoin ObserverAltcoin Observer
  • Regulation
  • Bitcoin
  • Altcoins
  • Market
  • Analysis
  • DeFi
  • Security
  • Ethereum
Categories
  • Altcoins (3,100)
  • Analysis (3,228)
  • Bitcoin (3,842)
  • Blockchain (2,157)
  • DeFi (2,623)
  • Ethereum (2,573)
  • Event (118)
  • Exclusive Deep Dive (1)
  • Landscape Ads (2)
  • Market (2,714)
  • Press Releases (12)
  • Reddit (2,529)
  • Regulation (2,461)
  • Security (3,644)
  • Thought Leadership (3)
  • Videos (44)
Hand picked
  • Bitcoin Reclaims $72,000 as US-Iran Ceasefire Sparks Market Rally
  • Ethereum approaches $2.2k: yet THESE downside risks could block ETH prices
  • Wirex and Utorg Bring Seamless Crypto-to-Card Spending to Over 2 Million Users Worldwide
  • What are digital assets? A complete guide for businesses
  • My Take on Ledger after 3 days
We are social
  • Facebook
  • Twitter
  • Instagram
  • YouTube
Facebook X (Twitter) Instagram
  • About us
  • Disclaimer
  • Terms of service
  • Privacy policy
  • Contact us
Facebook X (Twitter) Instagram YouTube LinkedIn
Altcoin ObserverAltcoin Observer
  • Regulation
  • Bitcoin
  • Altcoins
  • Market
  • Analysis
  • DeFi
  • Security
  • Ethereum
Events
Altcoin ObserverAltcoin Observer
Home»Ethereum»Ethereum looks ‘ready to challenge ATH,’ says IntoTheBlock
Ethereum

Ethereum looks ‘ready to challenge ATH,’ says IntoTheBlock

December 17, 2024No Comments
Share Facebook Twitter Pinterest LinkedIn Tumblr Reddit Telegram Email
Eth.webp.jpeg
Share
Facebook Twitter LinkedIn Pinterest Email


IntoTheBlock explained how Ethereum could challenge its all-time high (ATH) based on the current on-chain cost distribution.

Ethereum has little resistance on the way to the new ATH

In a new article on X, market intelligence platform IntoTheBlock explained what the on-chain cost breakdown for Ethereum currently looks like. Below is the chart shared by the analytics firm that details how many coins investors purchased in each price range near the current one.

Ethereum Cost Basis

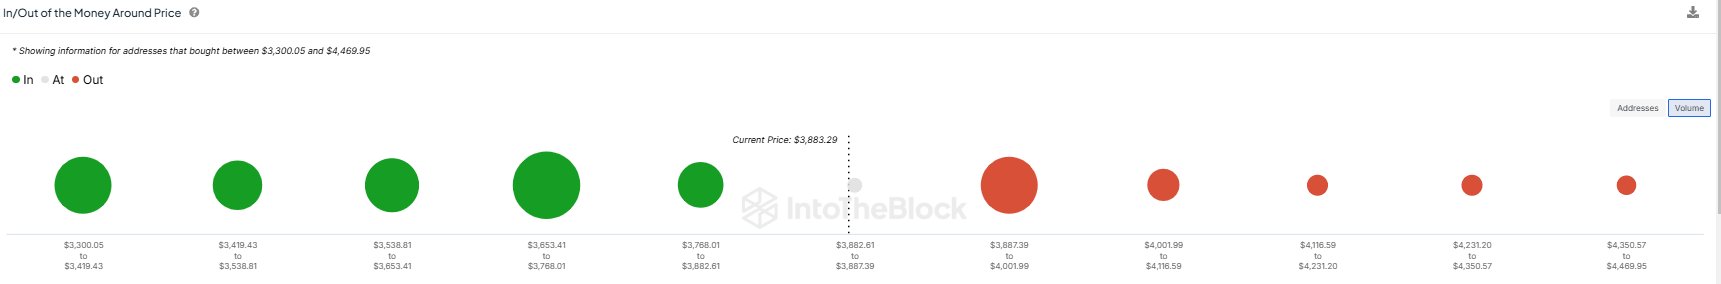
Looks like the levels ahead are relatively thin in terms of investor cost basis | Source: IntoTheBlock on X

On the chart, it is visible that several ranges below the current spot value of ETH are associated with a large point, which means that a large number of investors bought at these levels, while it did not There is only one such point for higher levels.

For any holder, their cost basis is naturally a level of interest, as a potential retest of it may lead to a reversal of their profit-loss status. So each time the price hits the level, they may be more inclined to show some sort of reaction.

A few investors showing any reaction isn’t enough to cause visible fluctuations in the market, but when a large number of addresses have their cost basis in a narrow range, as in these large dots on the chart, retesting can produce a reaction important enough to be relevant.

Exactly how investors might react to a retest of their breakeven point depends on the direction in which the retest takes place. Investors who were in losses before the retest may decide to sell, fearing that Ethereum could decline again in the near future.

However, when the retest takes place from above, holders may be tempted to believe that the price would rise once again, and therefore may decide to participate in further accumulation.

Due to these buying and selling effects, significant cost base centers below the price are considered support zones, while those above may prove to be resistance blocks.

As it stands, Ethereum has many old ranges, but only one of the latest type. “With only minor on-chain resistance levels ahead, ETH appears poised to challenge its previous all-time high,” notes IntoTheBlock.

Additionally, the ETH funding rate has recently seen an increase to a multi-month high, as noted by an analyst in a CryptoQuant Quicktake article.

Ethereum Funding Rate

The trend in the ETH Funding Rate over the past year or so | Source: CryptoQuant

The “Funding Rate” is an indicator that tracks the ratio between long and short positions open on the Ethereum derivatives market. The indicator currently has a notable positive value, which suggests the dominance of bullish sentiment.

While some bullish mentality can be positive for rallies, too much can be a warning sign. It now remains to be seen whether ETH will be able to continue operating despite the high funding rate or whether it will first observe a cooling period.

ETH Price

At the time of writing, Ethereum is trading at around $3,900, up over 7% over the past week.

Ethereum Price Chart

The price of the coin seems to have been stuck in consolidation recently | Source: ETHUSDT on TradingView

Featured image from Dall-E, CryptoQuant.com, IntoTheBlock.com, chart from TradingView.com


Source link

Share. Facebook Twitter Pinterest LinkedIn Tumblr Email
Previous ArticlePepe Unchained Lists on CEX, to launch 2x staking rewards
Next Article What is abstract? The consumer crypto blockchain from the creators of Pudgy Penguins

Related Posts

Ethereum

Ethereum’s Role Expands as It Is Considered for Euro Stable Settlement

April 8, 2026
Ethereum

Ethereum Futures Activity Runs 7x Faster Than Spot – What This Means for the Market

April 7, 2026
Ethereum

Ethereum Price Rises to $20,000: The Accumulation Zone Indicates Buying Time

April 6, 2026
Add A Comment
Leave A Reply Cancel Reply

Single Page Post
Share
  • Facebook
  • Twitter
  • Instagram
  • YouTube
Featured Content
Event

Global Games Show Riyadh: The Ultimate Creator & Influencer Hub

March 31, 2026

The fast-evolving gaming ecosystem of Riyadh is powered by solid national investment, a flourishing esports…

Event

AI Future: The leading international forum on Artificial Intelligence & Web3

March 30, 2026

On April 14–15, AI Future will gather developers, researchers, entrepreneurs, investors, and representatives of major…

1 2 3 … 81 Next
  • Facebook
  • Twitter
  • Instagram
  • YouTube

Ethereum approaches $2.2k: yet THESE downside risks could block ETH prices

April 8, 2026

XRP Crypto Falls to $1.31 After Failed Breakout as Liquidity Dries Up

April 8, 2026

ASTER vs Hyperliquid: can the 34.3% growth in USD1 change market leadership?

April 8, 2026
Facebook X (Twitter) Instagram LinkedIn
  • About us
  • Disclaimer
  • Terms of service
  • Privacy policy
  • Contact us
© 2026 Altcoin Observer. all rights reserved by Tech Team.

Type above and press Enter to search. Press Esc to cancel.

bitcoin
Bitcoin (BTC) $ 71,929.00
ethereum
Ethereum (ETH) $ 2,254.35
tether
Tether (USDT) $ 1.00
xrp
XRP (XRP) $ 1.38
bnb
BNB (BNB) $ 613.69
usd-coin
USDC (USDC) $ 1.00
solana
Solana (SOL) $ 84.59
tron
TRON (TRX) $ 0.317835
figure-heloc
Figure Heloc (FIGR_HELOC) $ 1.03
staked-ether
Lido Staked Ether (STETH) $ 2,265.05