


Ethereum is showing early signs of recovery after a selloff on Friday that sent prices tumbling to $3,450. This drop occurred amid what analysts describe as the largest liquidation event in crypto market history, wiping out billions of leveraged positions on major exchanges. While the bulls briefly lost control during the panic, ETH has since begun to stabilize, with renewed buying interest emerging near key demand zones.
Related reading
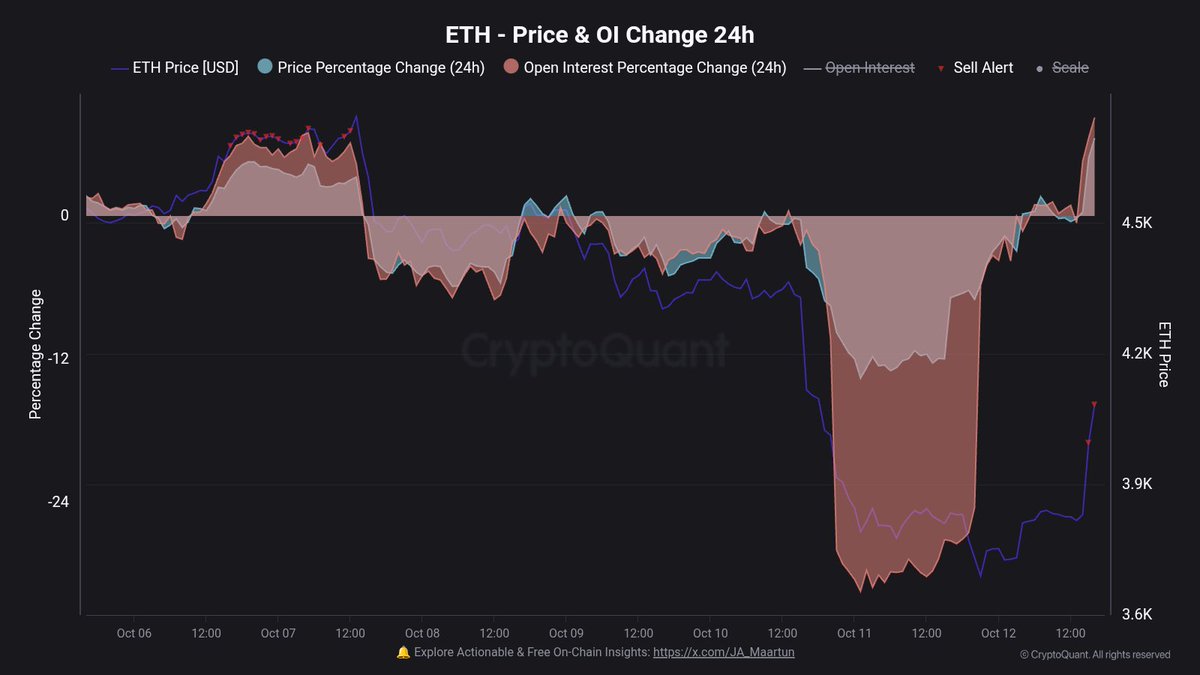
Onchain analyst Maartunn pointed out that leverage is building up again on Ethereum, signaling that traders are returning to the market after the reset. According to its data, open interest on ETH has increased significantly over the past 24 hours, a sign that speculative activity is picking up as volatility calms. This new leverage could pave the way for another decisive move, either fueling a near-term rally or inviting further selloffs if momentum fades.
The next few days will be crucial for Ethereum, as bulls attempt to reclaim the $4,000 level to confirm a sustainable recovery. Market sentiment remains cautious but optimistic, with online data showing that large holders and institutions continue to accumulate ETH despite recent turmoil – a potential signal of long-term confidence in the asset’s resilience.
Leveraging Returns on Ethereum: A Risky Resumption of Market Activity
According to Maartunn, Ethereum open interest jumped +8.2% in the last 24 hours – a clear sign that leverage is returning to the market. This rapid rise comes just days after the largest liquidation event in crypto history, in which overleveraged traders were wiped out in the sudden crash. Today, it seems that many are trying to “get their money back,” reigniting short-term volatility and speculation on the stock markets.
Maartunn notes that while these so-called “revenge pumps” often create strong intraday rallies, they rarely maintain long-term momentum. Historically, around 75% of similar debt-driven rallies tend to reverse, leading to further downturns once liquidity and funding rates normalize. Only about 25% manage to extend into sustained uptrends, usually when supported by new spot buying or institutional inflows.
This data highlights the precarious balance Ethereum currently faces. Rising Open Interest signals a resumption of market participation, but also introduces the risk of a new wave of forced liquidations if traders overextend their positions. For now, ETH’s near-term rally remains largely driven by derivatives activity rather than spot demand.
The next few days will be crucial in determining the direction of Ethereum. If the price holds above the $4,000 region with sustained volume, it could confirm that the bulls are regaining control. However, a sudden drop in open interest or sharp funding surges could signal that the rally is too extended, setting the stage for another correction.
Related reading
Ethereum rebounds, but resistance looms
Ethereum is showing a strong recovery after last week’s selloff that sent prices down to the $3,450 level. The daily chart shows that ETH quickly rebounded from the 200-day moving average (red line), confirming it as a major area of demand. Price is now consolidating near $4,150, attempting to build momentum after a strong bullish candle on high volume – a potential sign that buyers are regaining control.

However, ETH faces immediate resistance near the $4,250-$4,300 area, which coincides with the 50-day moving average (blue line). This area previously served as strong support, and its recovery would be essential to confirm the return to a bullish structure. The 100-day moving average (green line) is now flattening, reflecting the market’s cautious sentiment following the massive selloff.
Related reading
If the bulls manage to keep the price action above $4,000, the next targets are around $4,500 and possibly $4,750. Conversely, failure to meet the 200-day MA could open the door to a more in-depth retest of $3,600 or less. For now, Ethereum’s rally remains technically constructive, but it needs to overcome these resistance levels to confirm that the recent rebound is more than just a short-term reaction to oversold conditions.
Featured image from ChatGPT, chart from TradingView.com