


Join our Telegram channel to stay up to date with the latest news
The price of Ethereum plunged 5% in the past 24 hours to trade at $3,315 as of 2:26 a.m. EST on trading volume that increased 46% to $71 billion.
This drop in the price of ETH comes as 10x Search recommended shorting Ether as a potential hedge against Bitcoin.
According to the company, there are structural risks within the Ethereum network. The research firm also noted a decline in institutional demand as a key factor influencing strategy. This comes at a time when Bitcoin continues to attract treasury capital and Ethereum-focused companies are on the verge of running out of capital to invest in the asset.
According to 10X Research, this makes ETH a potential short selling opportunity for investors looking to hedge their exposure to the digital asset sector.
LATEST: ⚡ 10x Research has identified Ethereum as a potential short selling opportunity, highlighting structural weaknesses as Bitcoin continues to capture the majority of institutional treasury capital. pic.twitter.com/s79Jgc0fy8
– CoinMarketCap (@CoinMarketCap) November 5, 2025
Analysts said “digital asset cash flow” narratives around Ethereum led institutions to hoard ETH and later distribute it to retail investors, a trend that is now collapsing due to lack of transparency in private investment in public equity (PIPE) disclosures and uncertain capital flows.
10x Research later referenced BitMine, noting that the company’s strategy allowed institutional investors to accumulate ETH at par and then distribute it to retail buyers at a premium, a feedback loop that continued to drive prices higher.
Ethereum price tests key support after rounding top breakdown
THE ETH Price has recently entered a bearish phase after a strong recovery earlier in 2025.
After hitting a local high near $4,915, Ethereum price formed a rounded top pattern, which indicates a change in momentum from bullish to bearish.
ETH price has since declined sharply below the $4,400 and $3,800 levels, and is currently testing the $3,200 to $3,300 support zone.
This area aligns with the 0.618 Fibonacci retracement level ($3,221) of the previous rally, which is a crucial point where buyers often attempt to regain control.
The 1-day chart also shows that ETH has fallen below its 50-day simple moving average (SMA) at $4,094, while it is currently near the 200-day SMA at $3,378, an important long-term trend indicator. If the bulls manage to defend this support and push prices back above $3,500, it could confirm a potential rebound and prevent a deeper correction.
The Relative Strength Index (RSI) is currently hovering around 30.86, close to the oversold zone, showing that the bears are in control of the price.
Meanwhile, the Moving Average Convergence Divergence (MACD) indicator continues to support bearish momentum, with the blue MACD line well below the orange signal line.
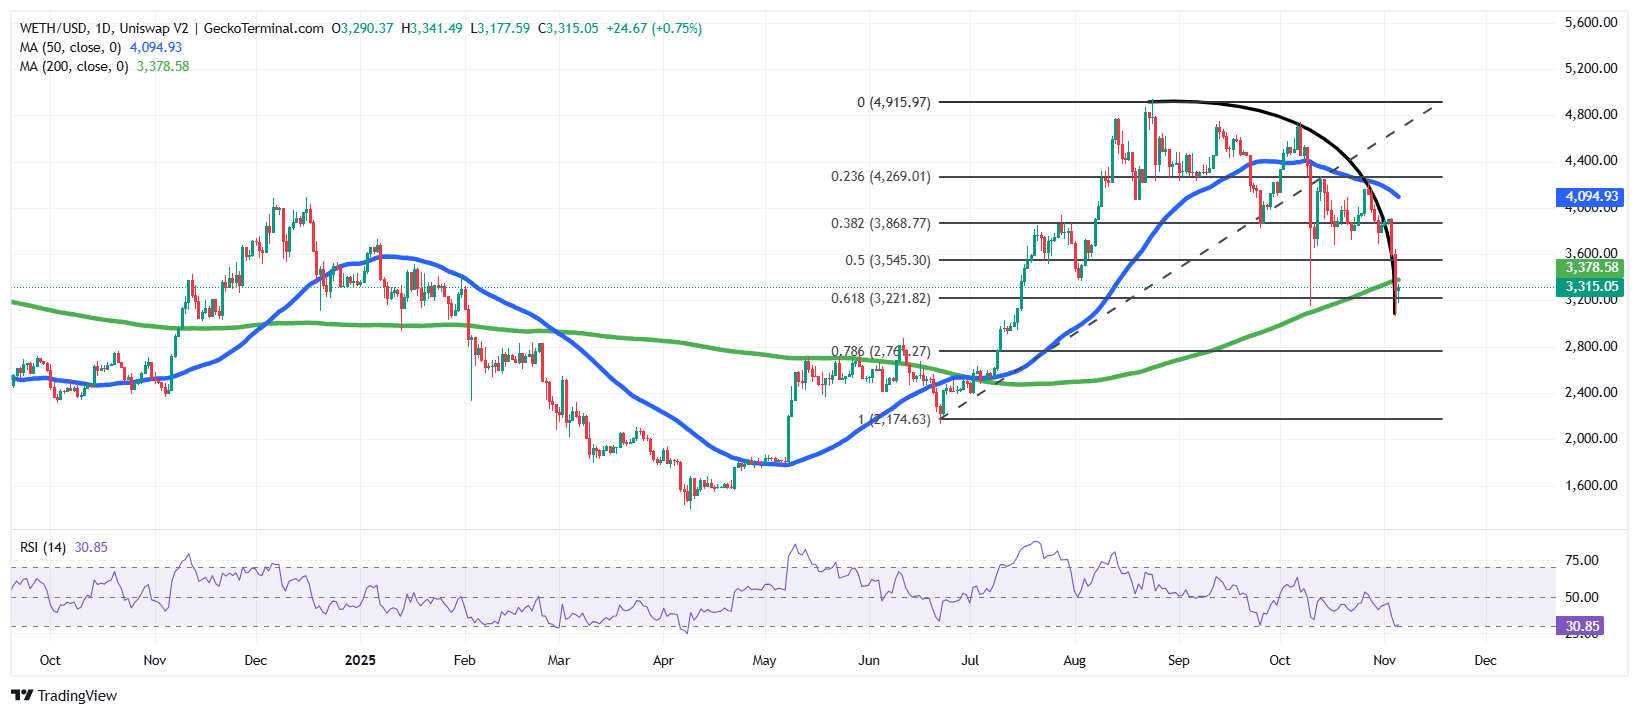
ETH price outlook: decline under control, but rebound possible
From a technical perspective, the trend remains bearish as long as ETH price trades below the 50 and 200 day SMAs. Immediate resistance lies around $3,545 (the 0.5 Fibonacci level), followed by $3,868.
A daily close above these levels could mark the start of a near-term recovery towards $4,000 to $4,200.
Conversely, if the $3,200 support level fails to hold, the next downside target lies between $2,780 and $2,800.
Overall, Ethereum’s chart structure indicates a market at a critical juncture, with bears in control, but technical indicators suggest an upcoming oversold bounce.
Related news:
Best Wallet – Diversify your crypto portfolio

- Easy-to-use, feature-driven crypto wallet
- Get Early Access to Upcoming Token ICOs
- Multi-chain, multi-wallet, non-custodial
- Now on App Store, Google Play
- Stake to win a $BEST native token
- More than 250,000 active users per month
Join our Telegram channel to stay up to date with the latest news