


Join our Telegram channel to stay up to date with the latest news
The price of Ethereum has fallen 4% in the past 24 hours, falling to around $2,744, as selling pressure builds, and veteran trader Peter Brandt has warned that Ethereum’s decline may not be over yet.
Brandt highlights the breakdown of a symmetrical triangle on the Ethereum 24-hour chart, a trend he describes as a well-known bearish signal that often leads to further losses when confirmed. According to him, this breakdown indicates that sellers remain in control, especially in an environment of low market liquidity and continued capital outflows.
These conditions make it harder for Ethereum to recover, as even small sell orders can cause prices to fall. Brandt adds that the lack of strong buying interest means rallies will likely be short-lived unless market conditions improve. It also places Ethereum’s weakness in a broader market context.

Brandt highlights a right-angle widening trend on the total cryptocurrency market cap chart. Following the recent stock market crash, the total value of the crypto market has already dropped to around $2.82 trillion. He warns that if this trend continues, the total market capitalization could fall to $2.41 trillion.
ETF outflows and weak sentiment add to bearish pressure
This would represent a further 15-20% decline from current levels and could keep major cryptocurrencies such as Bitcoin, Ethereum and XRP under continued pressure. Ethereum’s poor technical outlook corresponds with weakening sentiment in the broader crypto market. The second-largest cryptocurrency has lost more than 46% of its value in recent months, reflecting both global macroeconomic uncertainty and challenges specific to the crypto sector.
One of the main factors hurting sentiment has been the steady outflows from Ethereum spot exchange-traded funds, suggesting that institutional investors are becoming more cautious. On Thursday alone, spot ETH ETFs saw nearly $156 million in net outflows.
Fidelity’s FETH saw the largest withdrawals at $59.2 million, followed by BlackRock’s ETHA at $54.9 million. Grayscale’s ETHE and ETH products also saw significant outflows of $13.1 million and $26.5 million, respectively. These continued buybacks reinforce concerns that institutional demand for Ethereum remains weak in the near term.
Ethereum price falls below key support
Ethereum (ETH/USD) on a 4-hour time frame shows a clear shift in market structure, with bearish momentum now dominating after a decisive break below key support. The price action highlights a failed recovery attempt that turned into a strong bearish continuation.
Initially, ETH formed a rounded bottom pattern, signaling a gradual accumulation phase. This structure allowed the price to rally towards the upper resistance zone around the $3,300-$3,350 region, which previously served as a significant supply zone. However, repeated rejections from this resistance zone indicated weak bullish follow-through, suggesting that sellers remained firmly in control.
Following the rejection, ETH fell below the major support level near $2,950-$3,000, which had served as a demand zone during the previous consolidation. This breakout is technically significant, as former support has now turned into resistance. This decision was impulsive, confirming a bearish breakout rather than a false move or liquidity sweep.
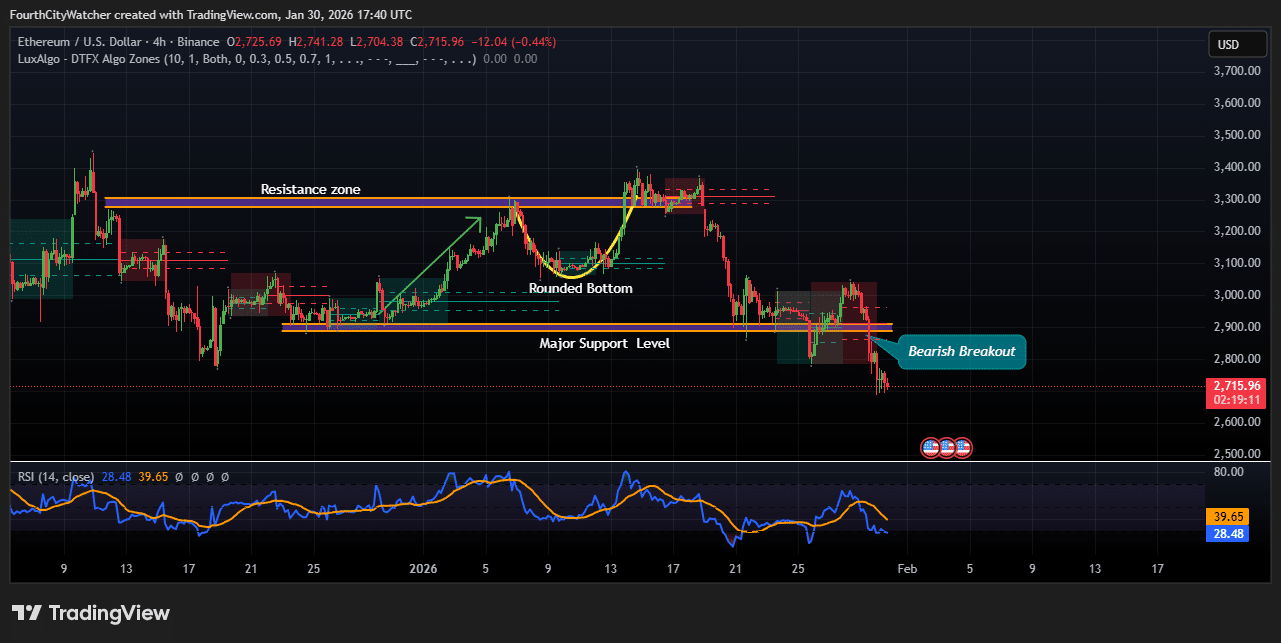
ETHUSD chart analysis. Source: Tradingview
Momentum indicators reinforce the bearish bias. The RSI (14) has fallen towards the lower range, hovering near oversold territory but without showing any bullish divergence. This suggests that selling pressure remains active and any near-term rebound could be corrective rather than trend reversal. The RSI failing to recover the midline of 50 further confirms bearish control.
Structurally, ETH is now forming lower highs and lower lows, a classic downtrend signal on the 4-hour chart. The bearish expansion of the candles after the support breakout also indicates strong selling participation rather than weak retail moves.
Looking ahead, the next key area to watch is around the $2,650-$2,700 region, which could serve as a temporary demand zone or pause zone. If this level fails to maintain, downside risk could extend to deeper liquidity zones. On the positive side, any recovery attempts will likely face resistance near the broken support band at $2,950 to $3,000.
Related articles:
Best Wallet – Diversify your crypto portfolio

- Easy-to-use, feature-driven crypto wallet
- Get Early Access to Upcoming Token ICOs
- Multi-chain, multi-wallet, non-custodial
- Now on App Store, Google Play
- Stake to win a $BEST native token
- More than 250,000 active users per month
Join our Telegram channel to stay up to date with the latest news