Close Menu
Altcoin ObserverAltcoin Observer
  • Regulation
  • Bitcoin
  • Altcoins
  • Market
  • Analysis
  • DeFi
  • Security
  • Ethereum
Categories
  • Altcoins (2,892)
  • Analysis (3,031)
  • Bitcoin (3,640)
  • Blockchain (2,157)
  • DeFi (2,619)
  • Ethereum (2,479)
  • Event (106)
  • Exclusive Deep Dive (1)
  • Landscape Ads (2)
  • Market (2,708)
  • Press Releases (11)
  • Reddit (2,321)
  • Regulation (2,461)
  • Security (3,499)
  • Thought Leadership (3)
  • Uncategorized (2)
  • Videos (43)
Hand picked
  • Brazil redefines Latin America’s crypto map as banks and major institutions step in
  • HOLY What’s going on?
  • Ethereum: Sharplink losses exceed $1 billion as ETH falls below $2,000
  • Ethereum: Sharplink losses exceed $1 billion as ETH falls below $2,000
  • Bitcoin Reclaims $71,000 With ETF’s $1.1 Billion Raise, Strategy’s $200 Million Bet
We are social
  • Facebook
  • Twitter
  • Instagram
  • YouTube
Facebook X (Twitter) Instagram
  • About us
  • Disclaimer
  • Terms of service
  • Privacy policy
  • Contact us
Facebook X (Twitter) Instagram YouTube LinkedIn
Altcoin ObserverAltcoin Observer
  • Regulation
  • Bitcoin
  • Altcoins
  • Market
  • Analysis
  • DeFi
  • Security
  • Ethereum
Events
Altcoin ObserverAltcoin Observer
Home»Ethereum»Ethereum Whales Selling Relentlessly for 6 Months, Data Shows
Ethereum

Ethereum Whales Selling Relentlessly for 6 Months, Data Shows

October 9, 2024No Comments
Share Facebook Twitter Pinterest LinkedIn Tumblr Reddit Telegram Email
Eth.webp.jpeg
Share
Facebook Twitter LinkedIn Pinterest Email


On-chain data shows that Ethereum whales have participated in a steady distribution over the past six months, a sign that is not ideal for ETH.

Ethereum Accumulation Trend Score Turned Red Across Cohorts

As Analyst James Van Straten pointed out in a new article on X that the accumulation trend score has recently shown a gloomy picture for Ethereum. The “Accumulation Trend Score” here refers to an indicator from Glassnode that tells us whether investors in a given asset are accumulating or not.

This measure takes into account not only the net balance changes that occur in investors’ portfolios, but also the size of the entities. This means that larger entities have a higher weight in the indicator. When the score value is close to 1, it means either that large investors are participating in heavy accumulation or that a large number of small holders are buying. On the other hand, being close to 0 implies that a net distribution is occurring in the network or at least, that there is a lack of accumulation.

In the context of the current topic, the version of the accumulation trend score that interests us is that of individual cohorts. The addresses have been divided into these groups based on the balance they carry.

Now here is a chart that shows the trend of Ethereum’s accumulation trend score for different cohorts over the past year:

Bitcoin Accumulation Trend Score

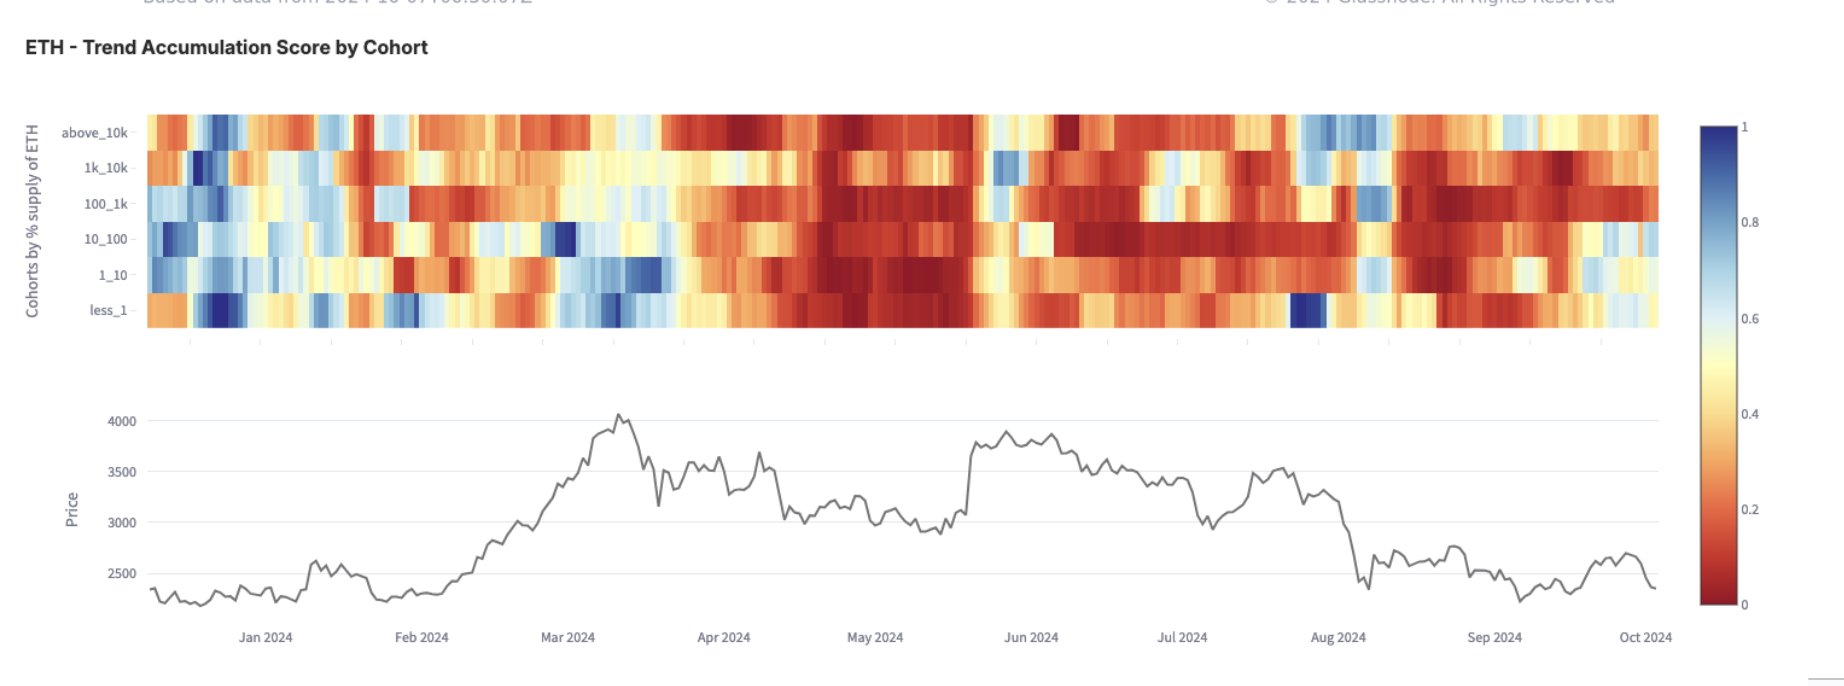
The value of the metric appears to have been red for most of the cohorts recently | Source: @btcjvs on X

As seen in the chart above, the Ethereum trend accumulation score showed a shade of blue in the cohorts at the start of the year, implying that investors as a whole were participating in some degree of accumulation .

However, shortly after Bitcoin’s (ATH) all-time high in March, investors began selling aggressively, with the indicator’s value taking on a dark red color (i.e. very close to zero). Since the initial strong distribution, sales have calmed in recent months, but the metric is still trending toward the red. It should be noted that the 100-1,000 BTC, 1,000-10,000 BTC, and 10,000+ BTC groups are still in the distribution phase.

These cohorts are commonly called, in the same order, sharks, whales and mega-whales. Investors of this size can exert some influence on the market, so their participation in consistent sell-offs over the last six months or so is naturally not a good sign for Ethereum.

It is possible that until the various cohorts return to accumulation mode, ETH will not be able to achieve a significant recovery.

ETH Price

At the time of writing, Ethereum is floating around $2,400, down more than 7% over the past seven days.

Ethereum Price Chart

Looks like the price of the coin has been moving sideways over the last few days | Source: ETHUSDT on TradingView

Featured image of Dall-E, Glassnode.com, chart from TradingView.com


Source link

Share. Facebook Twitter Pinterest LinkedIn Tumblr Email
Previous ArticleMapping How DOT Can Finally Break $4.98 on the Charts
Next Article Pacific Island Nation Unveils Blockchain-Based ‘Palau Invest’ Savings Bond Prototype

Related Posts

Ethereum

Ethereum Lookback in 2020: How a 3.46M ETH Supply Floor Creates a Liquidity Vacuum

March 4, 2026
Ethereum

Ethereum exodus continues: supply on crypto exchanges dries up to lowest level in years

March 4, 2026
Ethereum

Ethereum Reaches Endgame? Founder Vitalik Buterin shares new development

March 3, 2026
Add A Comment
Leave A Reply Cancel Reply

Single Page Post
Share
  • Facebook
  • Twitter
  • Instagram
  • YouTube
Featured Content
Event

Brazil redefines Latin America’s crypto map as banks and major institutions step in

March 4, 2026

SÃO PAULO, 3 MARCH 2026 – The idea that crypto assets belong exclusively to startups…

Event

The Future of Web3 Unfolds at the Global Blockchain Show Riyadh

March 2, 2026

The Global Blockchain Show in Riyadh 2026 stands at the heart of the next evolution…

1 2 3 … 75 Next
  • Facebook
  • Twitter
  • Instagram
  • YouTube

Ethereum: Sharplink losses exceed $1 billion as ETH falls below $2,000

March 4, 2026

AAVE Jumps 7% on $42.5 Million Governance Boost – Can It Surpass $130?

March 4, 2026

Chiliz Approaches Key Resistance: What’s Behind CHZ’s Fragile Rally?

March 4, 2026
Facebook X (Twitter) Instagram LinkedIn
  • About us
  • Disclaimer
  • Terms of service
  • Privacy policy
  • Contact us
© 2026 Altcoin Observer. all rights reserved by Tech Team.

Type above and press Enter to search. Press Esc to cancel.

bitcoin
Bitcoin (BTC) $ 71,773.00
ethereum
Ethereum (ETH) $ 2,073.92
tether
Tether (USDT) $ 0.999966
bnb
BNB (BNB) $ 653.36
xrp
XRP (XRP) $ 1.41
usd-coin
USDC (USDC) $ 0.999965
solana
Solana (SOL) $ 90.14
tron
TRON (TRX) $ 0.284685
figure-heloc
Figure Heloc (FIGR_HELOC) $ 1.03
staked-ether
Lido Staked Ether (STETH) $ 2,265.05