Close Menu
Altcoin ObserverAltcoin Observer
  • Regulation
  • Bitcoin
  • Altcoins
  • Market
  • Analysis
  • DeFi
  • Security
  • Ethereum
Categories
  • Altcoins (1,158)
  • Analysis (1,359)
  • Bitcoin (1,932)
  • Blockchain (1,118)
  • DeFi (1,329)
  • Ethereum (1,324)
  • Event (48)
  • Exclusive Deep Dive (1)
  • Landscape Ads (2)
  • Market (1,369)
  • Reddit (585)
  • Regulation (1,274)
  • Security (1,828)
  • Thought Leadership (1)
  • Uncategorized (3)
  • Videos (39)
Hand picked
  • Top TV on CEXs In The April -$1.1 trillion Bear Market
  • The six -digit bitcoin rally triggers a rare price reversal in South Korea
  • The price pi jumps 11% like the list of Binances pour pi coin gains du field
  • New incoming XRP rally? The analyst thinks that this cycle is unique
  • Bitcoin nfts pump + 70% in daily sales, while BTC approaches
We are social
  • Facebook
  • Twitter
  • Instagram
  • YouTube
Facebook X (Twitter) Instagram
  • About us
  • Disclaimer
  • Terms of service
  • Privacy policy
  • Contact us
Facebook X (Twitter) Instagram YouTube LinkedIn
Altcoin ObserverAltcoin Observer
  • Regulation
  • Bitcoin
  • Altcoins
  • Market
  • Analysis
  • DeFi
  • Security
  • Ethereum
Events
Altcoin ObserverAltcoin Observer
Home»Altcoins»Hyperliquid: HYPE could see a rebound based on THESE key levels
Altcoins

Hyperliquid: HYPE could see a rebound based on THESE key levels

January 8, 2025No Comments3 Mins Read
Share Facebook Twitter Pinterest LinkedIn Tumblr Reddit Telegram Email
Editors 74 1000x600.jpg
Share
Facebook Twitter LinkedIn Pinterest Email


  • HYPE is currently trading in a descending channel, with further downside potential depending on how it reacts to its current level.
  • Key indicators and Total Value Locked (TVL) remain bearish. However, the RSI is gradually suggesting that the selling pressure may be easing.

Hyperliquid (HYPE) ranks among the top losers in the market, down 16.57% in the last 24 hours. This drop reduced his monthly gains to 64.93%.

How the token performs at its current price level will determine whether it experiences a significant rally or faces further losses as market sentiment weakens.

Will HYPE relate positively to this model?

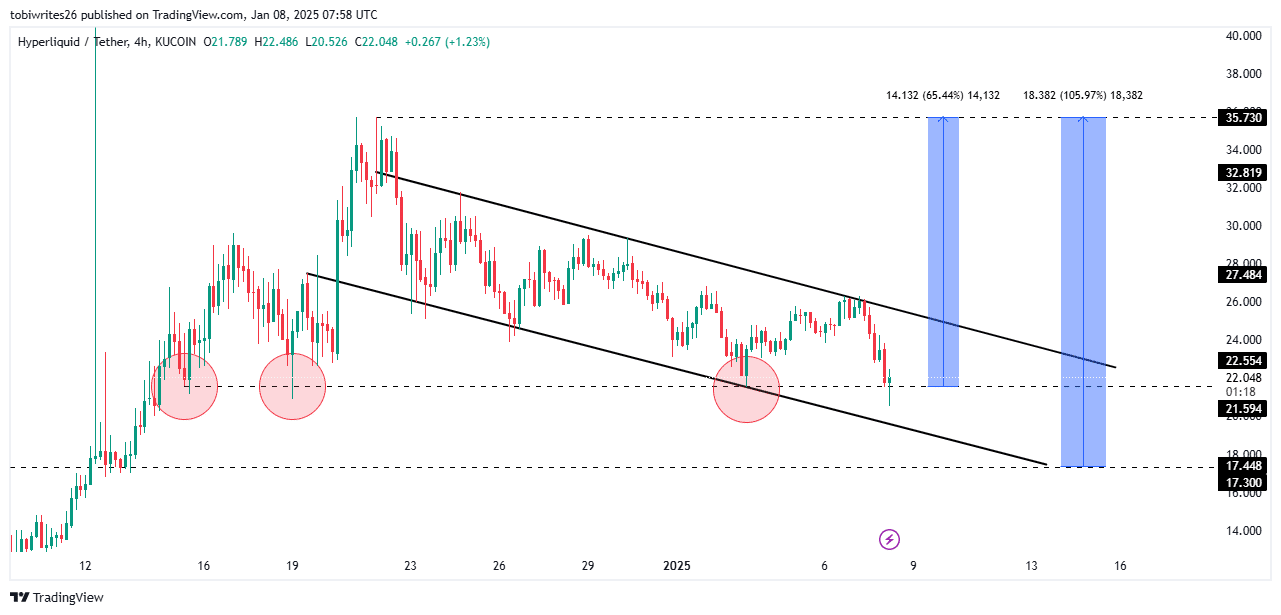
Technical analysis of the 4-hour chart of HYPE reveals that the asset is trading in a descending channel, characterized by lower highs and lower lows. Investors continue to accumulate in anticipation of an upward move.

A bullish breakout of this pattern occurs when price crosses the upper resistance line of the channel, potentially reaching its high of $35.7.

At the time of writing, HYPE is trading within a support zone at $21.59, which has already acted as a bullish catalyst three times. If this support provides the required momentum, HYPE could rebound and gain 65.44%, reaching the mentioned high.
Source: TradingView

However, if the support level at $21.59 is breached, HYPE could fall to the next support at $17.30. This level could act as a catalyst for a final push higher, potentially resulting in a 105.97% gain.

Mixed market signals

Currently, an analysis of technical indicators reveals mixed market sentiment, reflected by trader activity close to the support level.

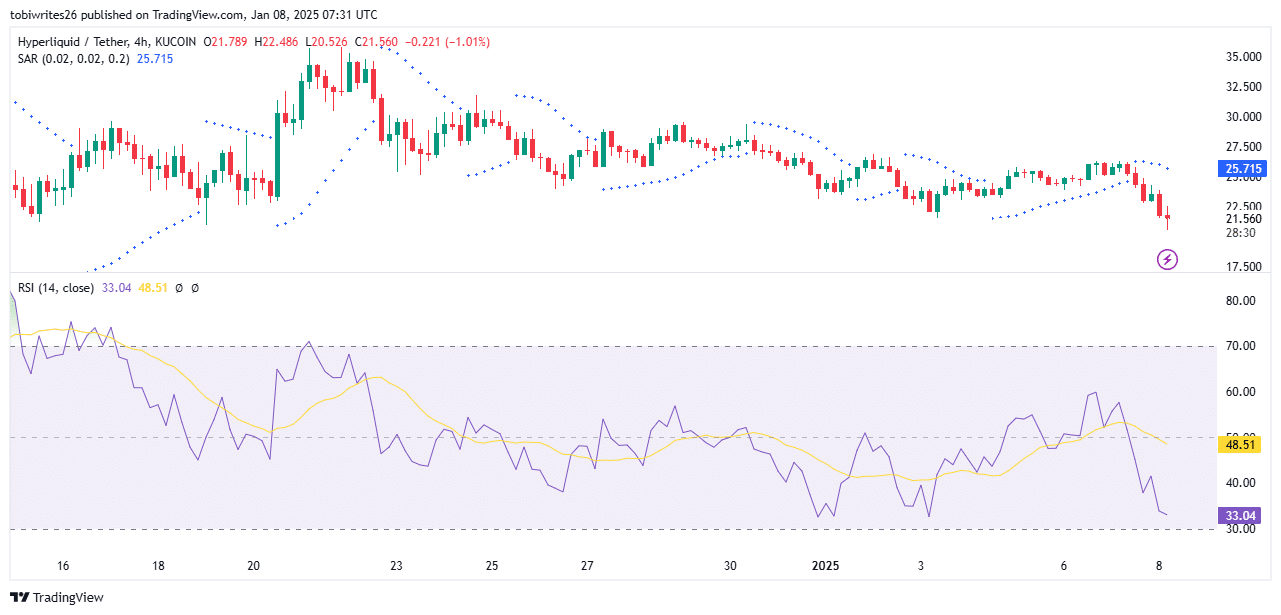
The Parabolic SAR (Stop and Reverse), which identifies trend directions and reversals through points placed above or below price movements, is currently showing points above HYPE.

Points above the price suggest bearish market sentiment for HYPE, indicating that it could fall further from its current zone.
Source: TradingView

Meanwhile, the Relative Strength Index (RSI), another technical indicator, measures the speed and magnitude of price changes to identify overbought or oversold conditions.

At the time of writing, the RSI stood at 33.04, indicating increasing selling pressure as it approaches the oversold region. The RSI was heading towards the oversold region (below 30), suggesting that selling pressure may ease at this level.

If HYPE falls below the 30 mark, it could rebound and begin a recovery. However, HYPE could reverse its trend from the current level without going below 30.

Cash outflow hits HYPE

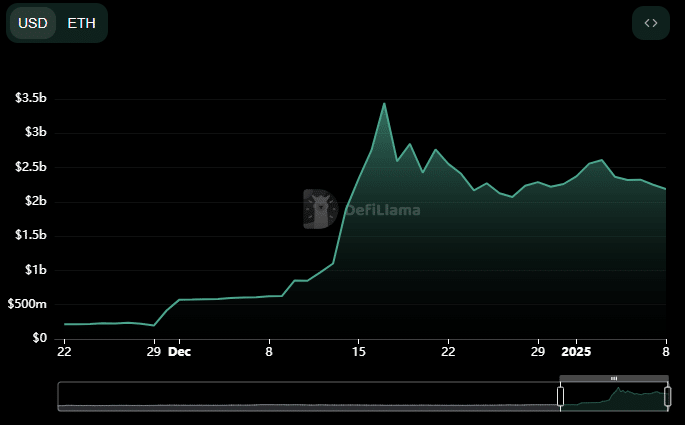
HYPE saw significant cash outflows as its TVL fell to $1.553 billion, a level last seen on December 14. This follows a peak of $2.244 billion on January 2.
Source: DeFiLlama


Read Hyperliquid (HYPE) Price Forecast 2025-2026


Cash outflows in TVL indicate declining interest, which often negatively impacts the price of HYPE and could lead to further declines.

If liquidity outflows persist, HYPE could continue to decline from its current level, or even fall to even lower levels.

Next: dogwifhat whale collects $13.34 million WIF: impact on price?


Source link

Share. Facebook Twitter Pinterest LinkedIn Tumblr Email
Previous ArticleBrett (BASED) Price Prediction – Can It Still Make Investors Millionaires?
Next Article Why is Bitcoin falling: Bulls and bears clash over BTC price

Related Posts

Altcoins

The price pi jumps 11% like the list of Binances pour pi coin gains du field

May 11, 2025
Altcoins

Hoskinson supports Starstream as a key to the future of Cardano

May 11, 2025
Altcoins

ChainLink (link) jumps 9% – is a major escape to come?

May 11, 2025
Add A Comment
Leave A Reply Cancel Reply

Single Page Post
Share
  • Facebook
  • Twitter
  • Instagram
  • YouTube
Featured Content
Videos

Tokenomics : The Mechanics and Magic of Decentralized Funding | Jason Fernandes | TEDxSDMIMD Mysuru

May 9, 2025

The Mechanics and Magic of Decentralized Funding explores the powerful intersection of blockchain technology, economic…

Event

Altcoin Observer – Official Media Partner for Dutch Blockchain Week 2025

May 9, 2025

30% off DBW Summit! Use code OBSERVER30 at dutchblockchainweek.com. Only for A.O and AdLunam Community …

1 2 3 … 44 Next
  • Facebook
  • Twitter
  • Instagram
  • YouTube

The price pi jumps 11% like the list of Binances pour pi coin gains du field

May 11, 2025

Hoskinson supports Starstream as a key to the future of Cardano

May 11, 2025

ChainLink (link) jumps 9% – is a major escape to come?

May 11, 2025
Facebook X (Twitter) Instagram LinkedIn
  • About us
  • Disclaimer
  • Terms of service
  • Privacy policy
  • Contact us
© 2025 Altcoin Observer. all rights reserved by Tech Team.

Type above and press Enter to search. Press Esc to cancel.

bitcoin
Bitcoin (BTC) $ 104,115.90
ethereum
Ethereum (ETH) $ 2,507.96
tether
Tether (USDT) $ 1.00
xrp
XRP (XRP) $ 2.37
bnb
BNB (BNB) $ 650.80
solana
Solana (SOL) $ 172.36
usd-coin
USDC (USDC) $ 1.00
dogecoin
Dogecoin (DOGE) $ 0.231866
cardano
Cardano (ADA) $ 0.808402
tron
TRON (TRX) $ 0.265266