


Dogecoin is trying to stabilize after a brutal upheaval, and one technician says the market just telegraphed its line in the sand. In a weekly chart shared on At chart time, price sits near $0.1828, with the blue 200-week moving average hovering just below the market around the $0.16 handle.
Is this the bottom of local Dogecoin?
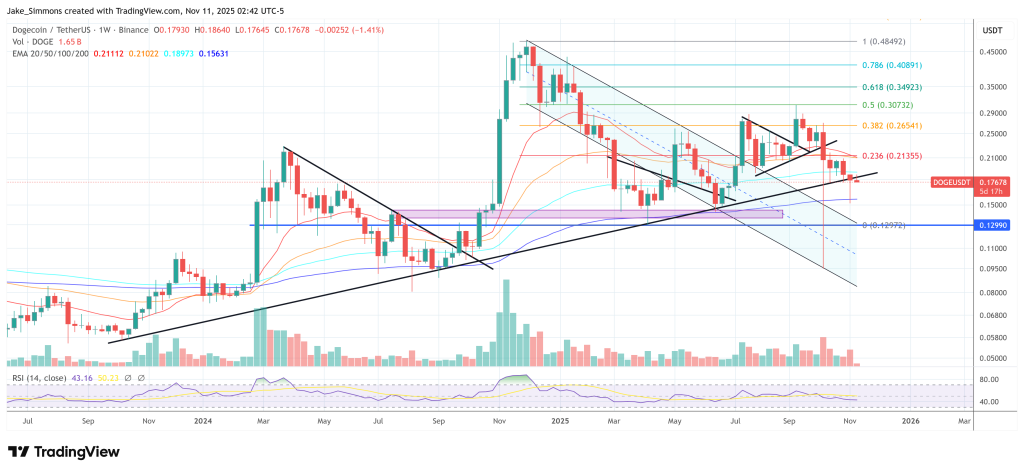
Kevin’s framework is simple and level-focused. It shows $0.202 as the immediate pivot on a three-day closing basis. Reclaiming $0.202, he says, would take DOGE back above the 0.5 Fibonacci macro retracement and simultaneously above the 3D 200 EMA/SMA, creating conditions for “upward momentum” if Bitcoin also holds above $106,800.
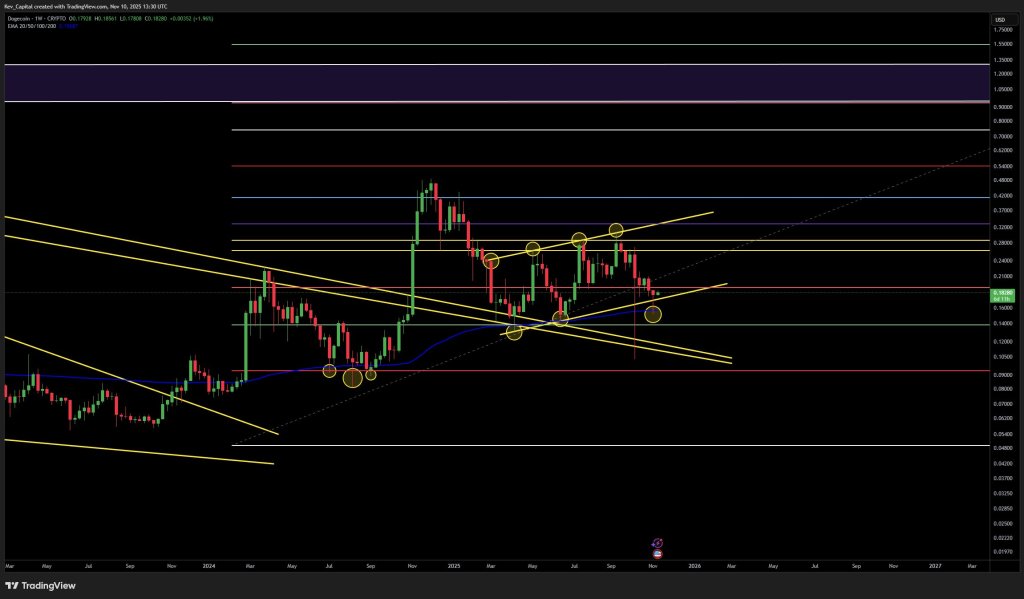
The weekly 200 EMA has preserved Dogecoin’s bullish structure six times since last summer. It continues to rise and, for now, remains the bulls’ last line of defense. Above this, the main frame is a narrow, upward-sloping channel, demarcated by two yellow rails, with multiple circled keys validating both support and resistance along the way. Price printed a long bearish wick in the lower rail and then rebounded, effectively defending the channel and the 200-week average in the $0.16 area.
Related reading
This reaction brought DOGE back into the previously charted range whose key horizontal levels are stacked in close succession: $0.24, $0.26, $0.285, and $0.305 overhead. These coincide with previous weekly turning points marked on the chart, as well as repeated strikes of the ascending upper trendline throughout the summer and early fall.
Below, the chart shows a sequence of safety nets that matter if the rebound fades. The green horizontal sits around $0.14, with deeper weekly shelves marked at $0.09 and $0.05. This support scale is reinforced by the remnants of an older, broader descending trendline, the underside of which now lies just below the recent wick; These legacy trendlines are still drawn and intersect below the current price, explaining the aggressive bidding that appeared during the weekly hunt.
The upward roadmap remains just as explicit. A sustained recovery of $0.202 to the three-day close is the trigger Kevin is watching; Above that, the market faces a stratified supply range between $0.21 and $0.24 and then larger highs between $0.285 and $0.305.
Related reading
The longer-term Fibonacci bands and historical weekly levels hold at $0.42, $0.54, and $0.74, all plotted on the right scale for context, but Kevin’s focus is clearly on the near-term recovery and moving average confluence around $0.202.
In short, the weekly rebound of the 200-EMA (~$0.16) kept DOGE within its 1-year channel and preserved a constructive trend of higher lows. Whether this rebound will evolve into a continuation of the trend now depends on reclaiming $0.202 on the three-day chart – Kevin’s chosen confirmation level – and, in his view, maintaining Bitcoin’s strength above $106,800.
Until then, DOGE remains range bound, with buyers defending the lower trendline and sellers repeatedly prevailing at the upper trendline.
Via could create upward momentum if this is done.”
At press time, DOGE was trading at $0.17678.
Featured image created with DALL.E, chart from TradingView.com