


Kaspa price is showing signs of a complete bullish reversal of its long downtrend after breaking a key descending trendline that has kept its price in check for months.
Summary
- The price of Kaspa rose 40% last week.
- Whales bought the recent decline in the KAS token.
- Several bullish reversal patterns were confirmed on the daily chart.
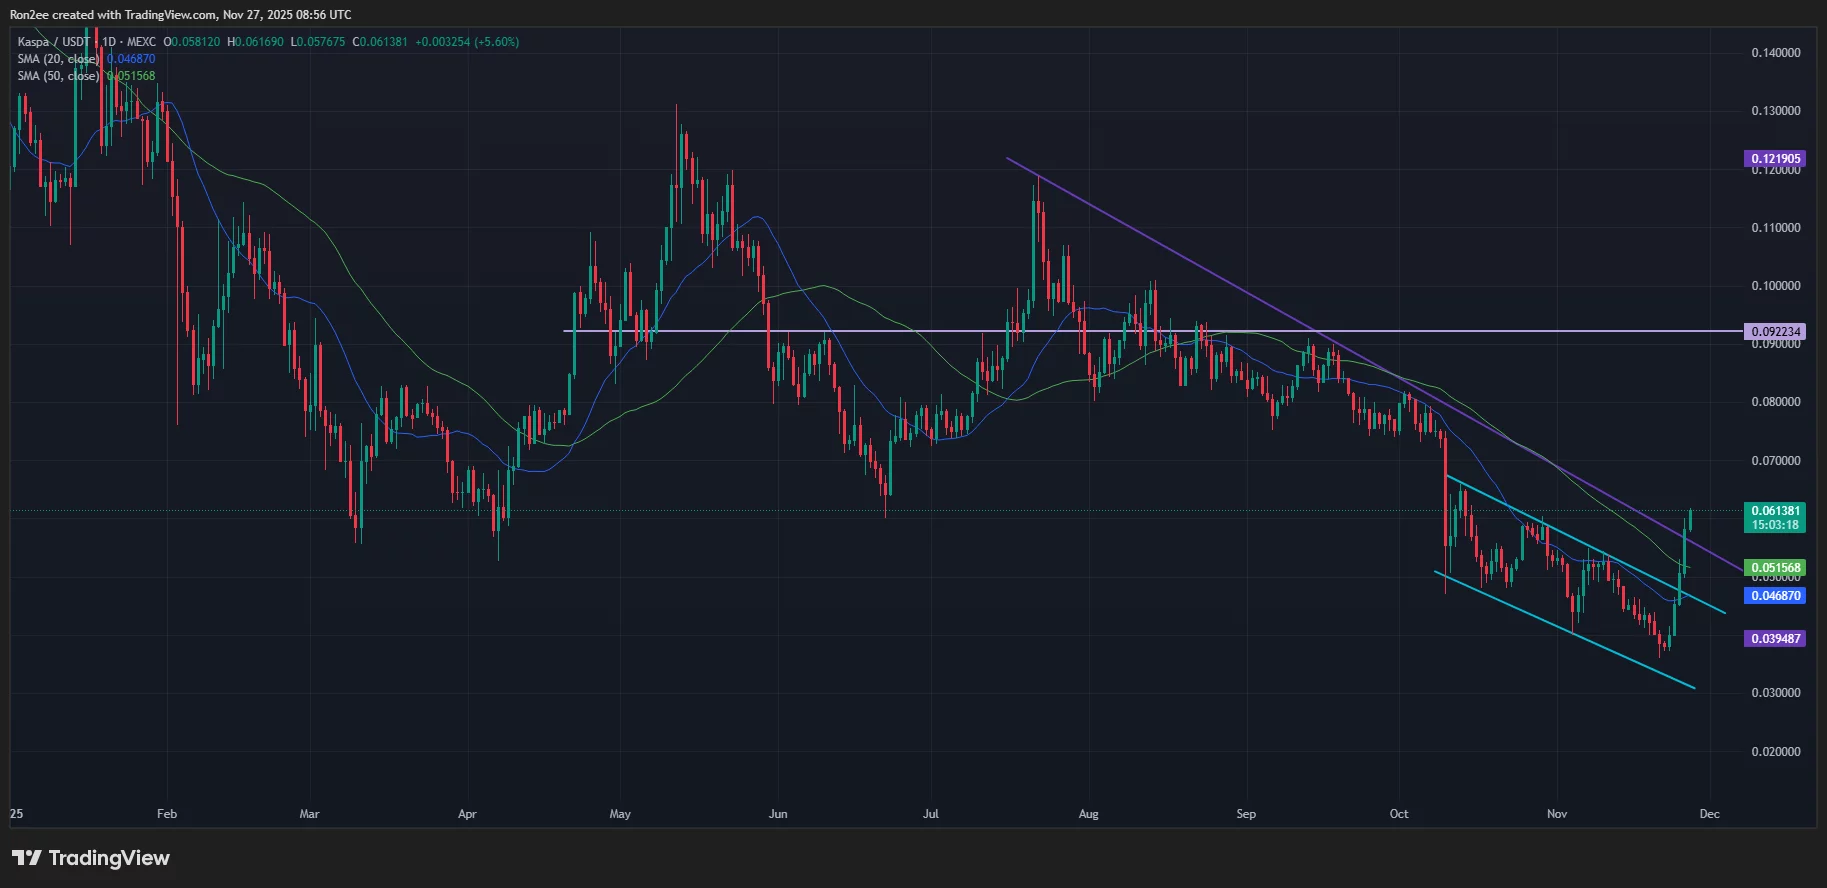
Kaspa (KAS) rose more than 40% over the past seven days to reach an intraday high of $0.061 on Thursday, November 27, its highest level since mid-October. Trading at $0.059 at press time, the PoW cryptocurrency still sits 48% below its July high, where its previous downtrend began before this week’s rebound.
Kaspa price rebounded after seeing renewed demand from whales after hitting a yearly low of $0.036 a few days earlier, likely forming the lowest.
According to a recent Kaspa Builders X article, eight Kaspa wallets bought the recent dip and accumulated over 35 million KAS tokens.
Investors often view these purchases from large players as a sign of confidence, which could lead to a major trend reversal in the short term. Notably, such activity, especially at a time when the broader crypto market is gripped by extreme fear, likely also played a role in triggering the rebound.
The recent accumulation of whales has likely attracted the attention of derivatives traders. Data from CoinGlass shows that Kaspa futures open interest jumped 25% over the past day to $79.2 million. Additionally, the long-short ratio has risen above 1, indicating that more traders are now turning to bullish bets.
A strong derivatives market can bolster positive sentiment among retail investors and help sustain Kaspa’s recent gains in the near term.
On the daily chart, Kaspa price broke out of a descending parallel channel pattern, which forms when the price of an asset trends downward with lower highs and lower lows while remaining within two descending trendlines.
Typically, when an asset’s price breaks out of such a trend, it signals a potential shift from a downtrend to an uptrend.
Kaspa price remains above the 20 and 50 day moving averages, indicating that the bulls have regained control of the short to medium term momentum.
More importantly, the altcoin broke out of a key descending trendline that had served as strong resistance since late July. Traders likely viewed this breakout as further confirmation that the bearish phase may be over and a new uptrend may be in progress.
As such, Kaspa could very likely rally back to $0.092, with no major resistance levels appearing on the chart between its current price and this target. It is about 55% above the current price.
On the other hand, $0.051, the 50-day moving average, remains the key support level to watch for in the event of a near-term pullback.
Disclosure: This article does not represent investment advice. The content and materials presented on this page are intended for educational purposes only.