Close Menu
Altcoin ObserverAltcoin Observer
  • Regulation
  • Bitcoin
  • Altcoins
  • Market
  • Analysis
  • DeFi
  • Security
  • Ethereum
Categories
  • Altcoins (3,028)
  • Analysis (3,158)
  • Bitcoin (3,769)
  • Blockchain (2,157)
  • DeFi (2,623)
  • Ethereum (2,541)
  • Event (116)
  • Exclusive Deep Dive (1)
  • Landscape Ads (2)
  • Market (2,714)
  • Press Releases (12)
  • Reddit (2,457)
  • Regulation (2,461)
  • Security (3,602)
  • Thought Leadership (3)
  • Videos (44)
Hand picked
  • Stablecoins Are a No-Brainer for B2B – So What’s Still Holding Everyone Back?
  • Crypto Czar No More, David Sacks Leaves Special Role – News Bytes Bitcoin News
  • HYPE soars 60% as Hyperion posts 64% growth in Q4 – How and why?
  • SpaceX IPO could allocate 30% to retail investors as Musk restructures X with job cuts
  • Meta explores using stablecoins after selling its Diem stablecoin project in 2022
We are social
  • Facebook
  • Twitter
  • Instagram
  • YouTube
Facebook X (Twitter) Instagram
  • About us
  • Disclaimer
  • Terms of service
  • Privacy policy
  • Contact us
Facebook X (Twitter) Instagram YouTube LinkedIn
Altcoin ObserverAltcoin Observer
  • Regulation
  • Bitcoin
  • Altcoins
  • Market
  • Analysis
  • DeFi
  • Security
  • Ethereum
Events
Altcoin ObserverAltcoin Observer
Home»Altcoins»Polkadot $10 Roadmap: Traders Pay Attention to THESE Levels
Altcoins

Polkadot $10 Roadmap: Traders Pay Attention to THESE Levels

January 7, 2025No Comments
Share Facebook Twitter Pinterest LinkedIn Tumblr Reddit Telegram Email
Editors 72 1000x600.jpg
Share
Facebook Twitter LinkedIn Pinterest Email


  • A significant breakout led to a high, followed by a correction, with support identified at $6.861.
  • The RSI was hovering around 50, indicating a balance between buying and selling forces.

Polkadot (DOT) showed dynamic price movements, piquing traders’ interest with key resistances, support levels, and on-chain metrics.

DOT exhibited notable price movements, with key resistance levels at $8.181, $9.573, and $10.490.
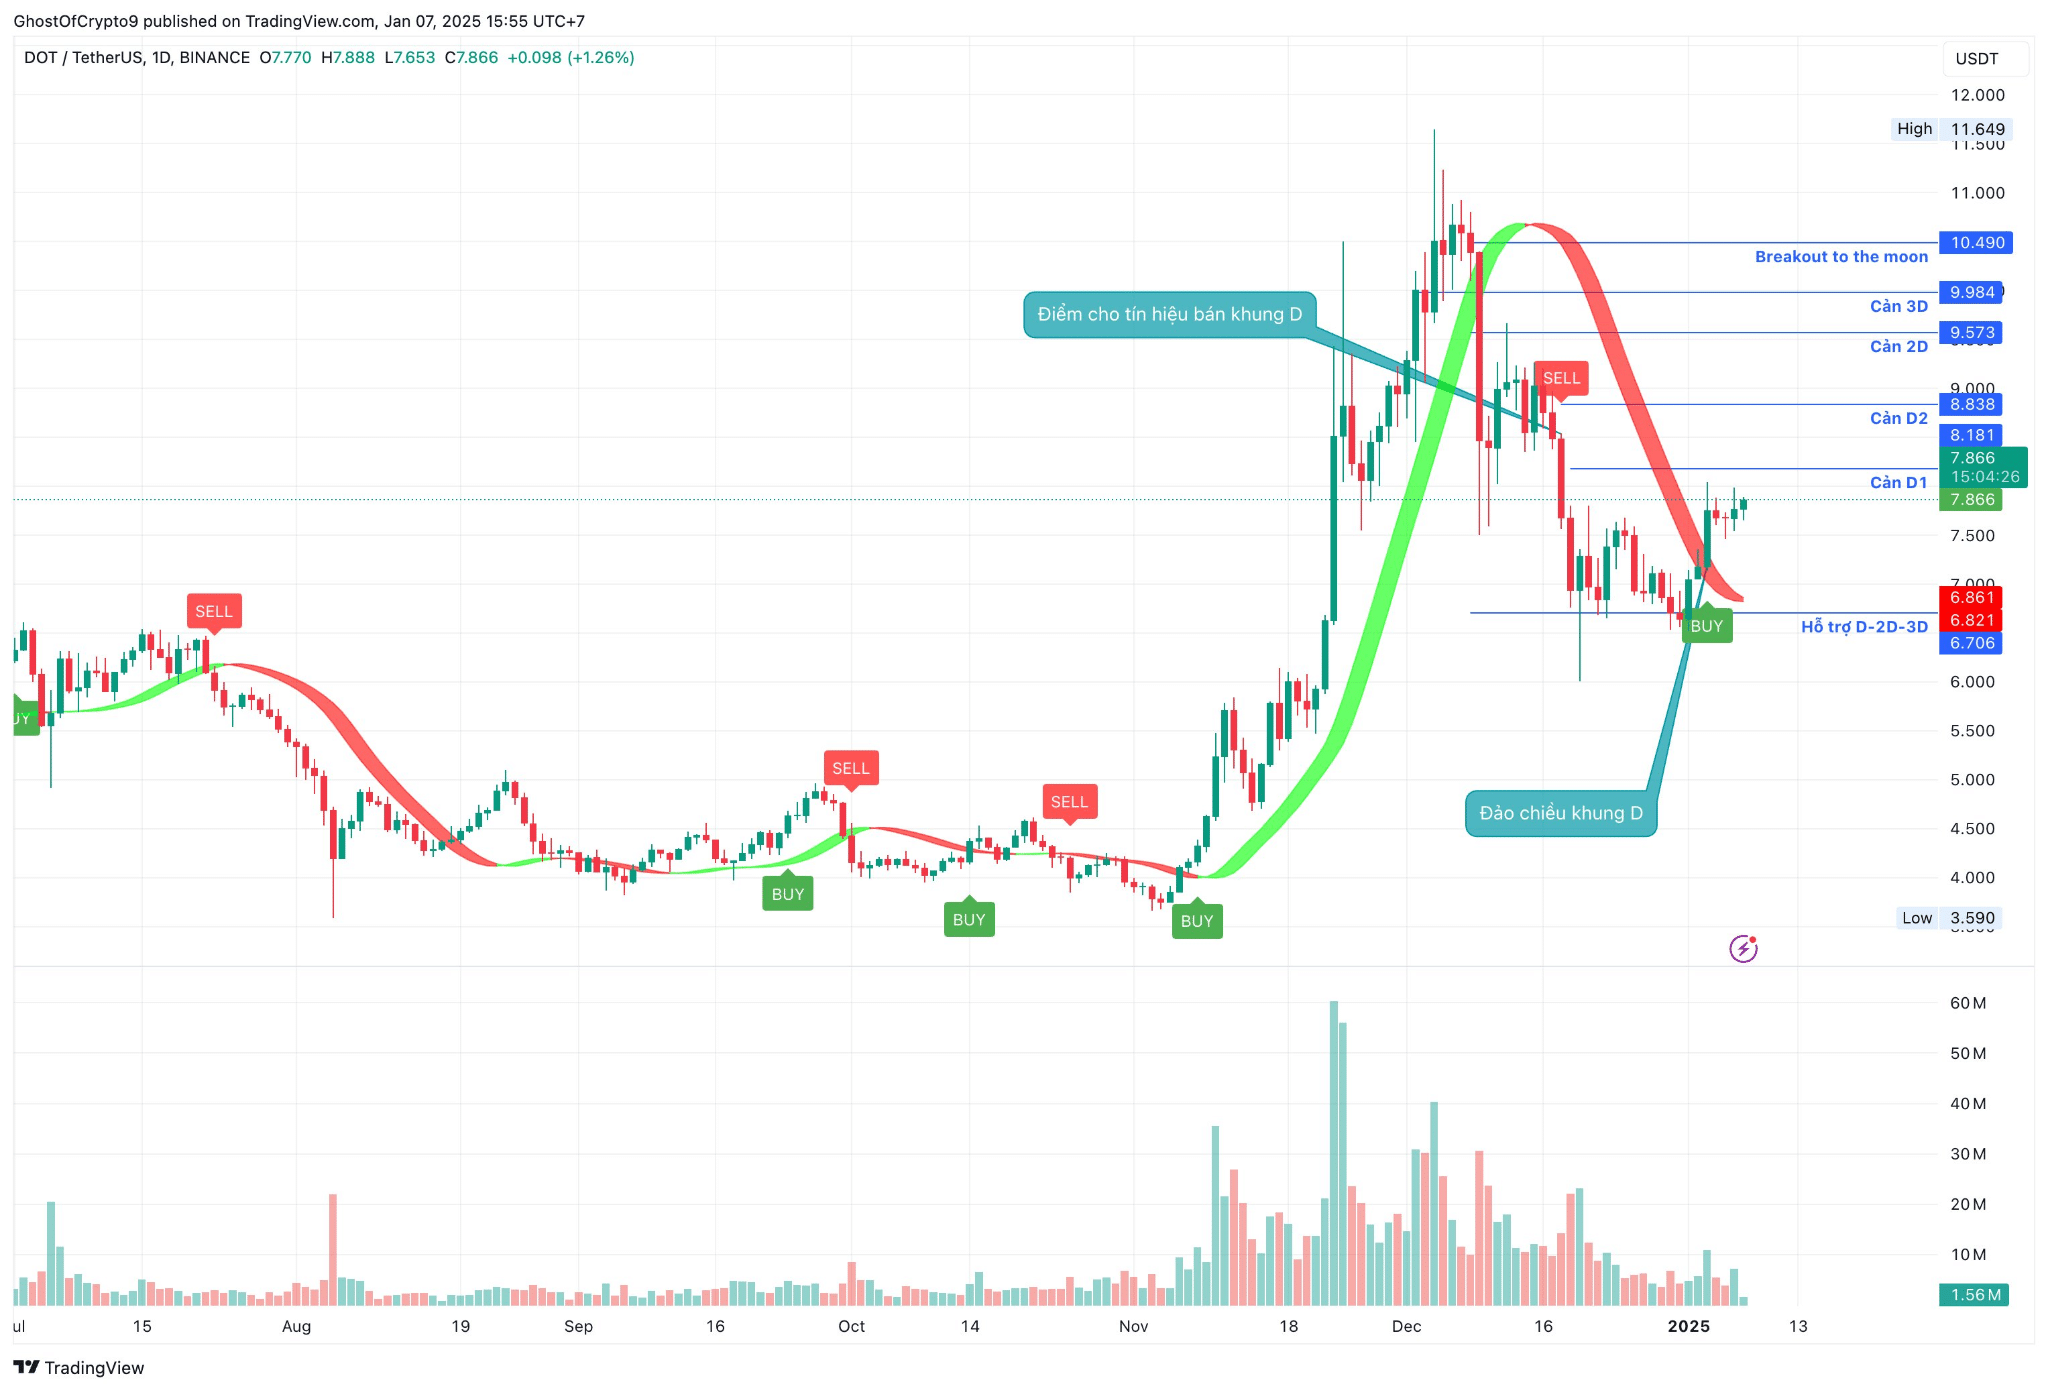
Source: TradingView

A significant breakout led to a high, followed by a correction, with support identified at $6.861.

Volume spikes during the uptrend indicated strong buying interest, while a consolidation near $7.866 suggested a potential recovery.

Evaluating Polkadot Momentum Using RSI

Traditionally, an RSI above 70 indicates overbought conditions, suggesting a potential price reversal or pullback, while an RSI below 30 indicates oversold conditions, implying a possible price increase.
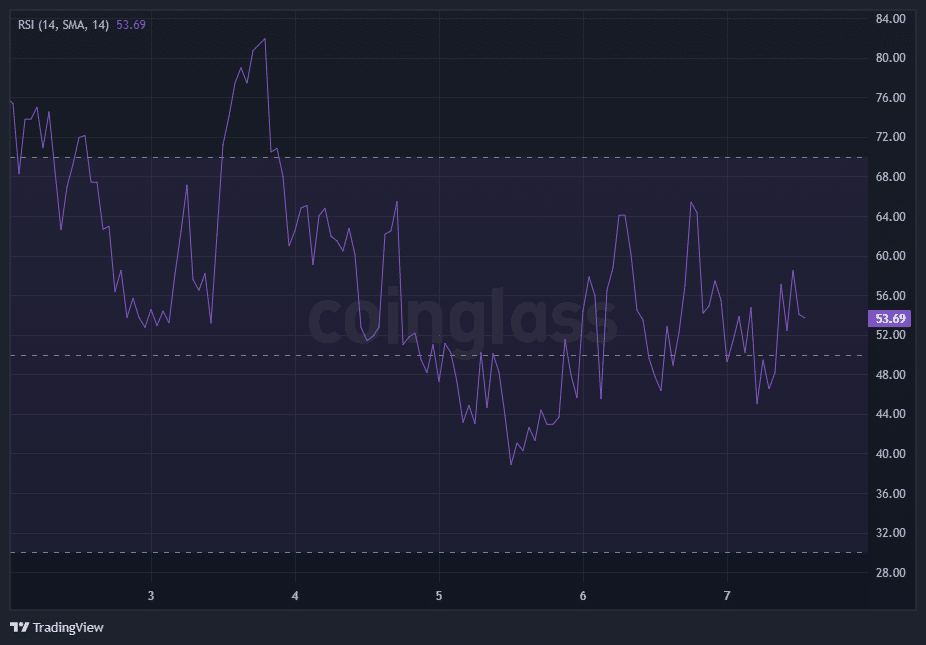
Source: CoinGlass

In Polkadot’s recent chart, the RSI approached overbought territory during the uptrend, signaling strong bullish momentum. As price peaked and corrected, the RSI fell towards neutral levels, reflecting the easing of buying pressure.

At the time of writing, the RSI was hovering around 50, indicating a balance between buying and selling forces. If the RSI moves back above 70, it could suggest renewed bullish momentum, potentially leading to a retest of resistance levels.

Conversely, a fall below 30 could indicate increased selling pressure and a possible decline towards support levels.

DOT MVRV Ratio: Is It Overvalued or Undervalued?

An MVRV ratio greater than one indicates that market value exceeds realized value, suggesting potential overvaluation, while a ratio less than one implies undervaluation.
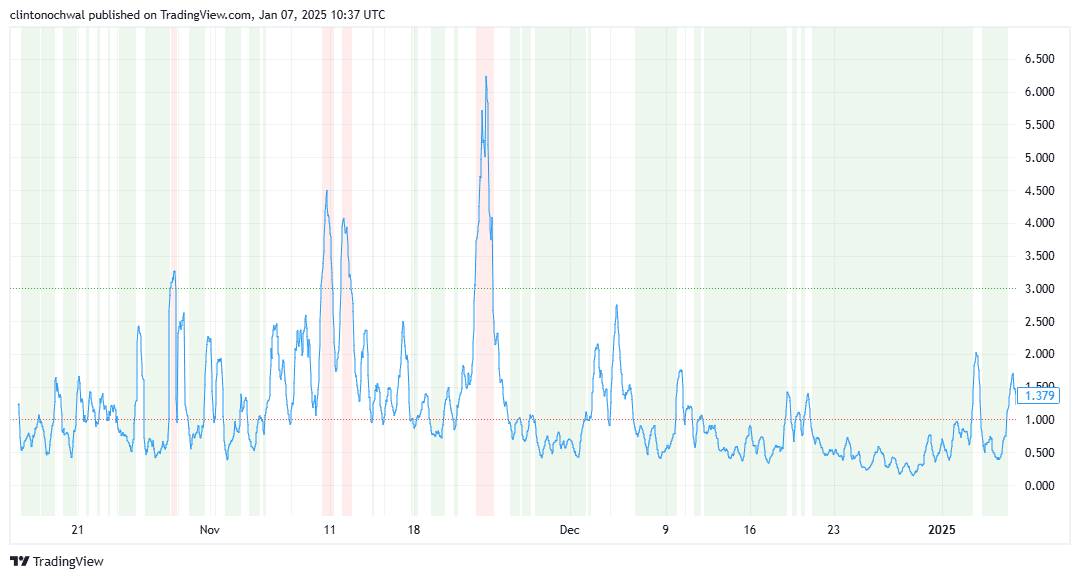
Source: TradingView

For Polkadot, the MVRV ratio rose above 1 during the recent uptrend, indicating that the market value was higher than the realized value, which is typical of bullish phases.

As the price corrected, the MVRV ratio decreased towards 1, reflecting a move towards a more neutral valuation. Currently, the MVRV ratio is slightly above 1, suggesting that Polkadot is slightly overvalued.


Read Polkadot (DOT) Price Prediction 2024-2025


A significant increase in the MVRV ratio could indicate increased bullish sentiment and potential price appreciation, while a decline below 1 could signal bearish trends and further price corrections.

Polkadot’s recent price movements have been characterized by significant fluctuations, with key resistance and support levels playing a crucial role.

The RSI and MVRV ratios provide valuable information on the dynamics and valuation of the asset, respectively.

Next: Ripple’s Bull Pennant Breakout: Can XRP Repeat Its 470% Rally?


Source link

Share. Facebook Twitter Pinterest LinkedIn Tumblr Email
Previous ArticleCoinbase scores rare legal victory as court grants interlocutory appeal in SEC case
Next Article Pudgy Penguins Price Prediction – Will $PENGU Hit $0.10 Soon?

Related Posts

Altcoins

HYPE soars 60% as Hyperion posts 64% growth in Q4 – How and why?

March 27, 2026
Altcoins

Will Solana drop to $57 next? What SOL’s KEY indicators suggest

March 27, 2026
Altcoins

Binance targets market makers “who break our rules” – but critics push back

March 26, 2026
Add A Comment
Leave A Reply Cancel Reply

Single Page Post
Share
  • Facebook
  • Twitter
  • Instagram
  • YouTube
Featured Content
Event

Africa’s Blockchain Leaders Convene in Lagos for ABDS 2026

March 26, 2026

Lagos, Nigeria – April 29–30, 2026 – The Africa Blockchain, DeFi & Web3 Summit (ABDS…

Event

After Token 2049 Dubai cancellation, industry attention turns to Paris Blockchain Week

March 24, 2026

Paris, March 24, 2026 – Following the announcement that Token 2049 Dubai will not take…

1 2 3 … 80 Next
  • Facebook
  • Twitter
  • Instagram
  • YouTube

HYPE soars 60% as Hyperion posts 64% growth in Q4 – How and why?

March 27, 2026

Will Solana drop to $57 next? What SOL’s KEY indicators suggest

March 27, 2026

Binance targets market makers “who break our rules” – but critics push back

March 26, 2026
Facebook X (Twitter) Instagram LinkedIn
  • About us
  • Disclaimer
  • Terms of service
  • Privacy policy
  • Contact us
© 2026 Altcoin Observer. all rights reserved by Tech Team.

Type above and press Enter to search. Press Esc to cancel.

bitcoin
Bitcoin (BTC) $ 68,430.00
ethereum
Ethereum (ETH) $ 2,061.80
tether
Tether (USDT) $ 0.999334
bnb
BNB (BNB) $ 627.66
xrp
XRP (XRP) $ 1.36
usd-coin
USDC (USDC) $ 0.999794
solana
Solana (SOL) $ 85.84
tron
TRON (TRX) $ 0.316689
figure-heloc
Figure Heloc (FIGR_HELOC) $ 1.02
staked-ether
Lido Staked Ether (STETH) $ 2,265.05