


Key notes
- Solana price holds above $135 despite 21Shares withdrawing its SOL staking ETF application.
- Derivatives data shows $12.5 million in bullish leverage added as traders counter bearish headlines.
- Solana ETFs returned to $5.3 million in inflows on Friday, signaling improved sentiment following Thursday’s $8.3 million withdrawal.
Solana price found firm support above $135 on Saturday, November 29, positioning the asset to close the week with gains of around 6% despite bearish sentiment triggered by 21Shares’ withdrawal of its Solana staking ETF application, citing difficulties meeting regulatory obligations.
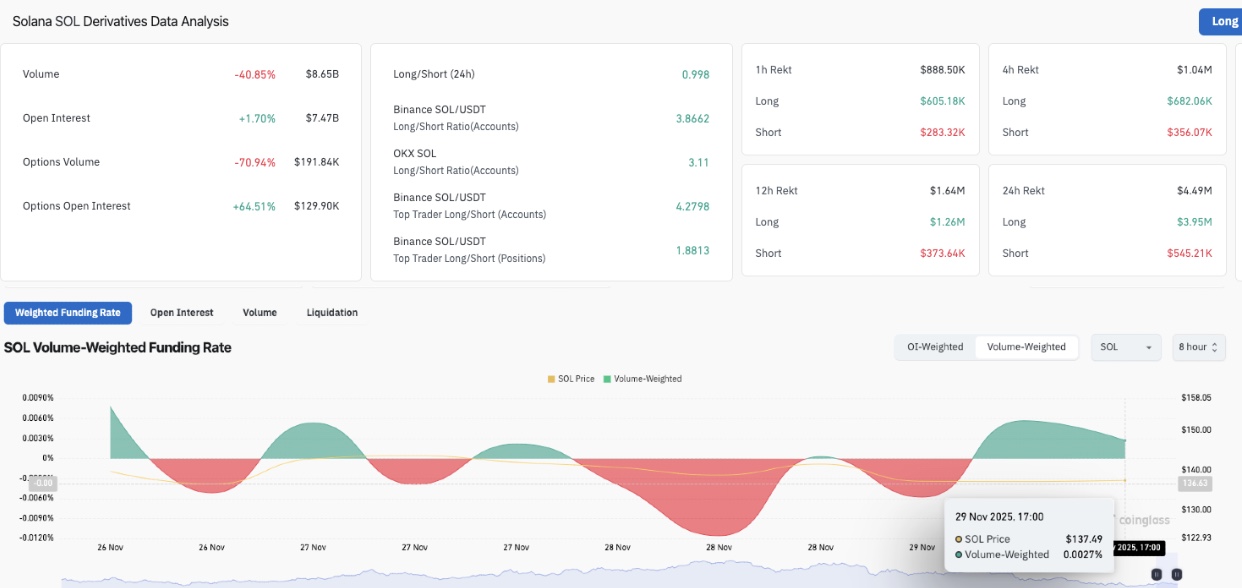
Solana open interest rises 1.7% as bulls defend $135 support after 21Shares withdrew its SOL ETF staking application. | Source: Coinglass
The resilience of bullish traders softened the downside impact, with Coinglass data showing Solana open interest rose 1.7%, even as SOL price fell 1.25% intraday in spot markets. This indicates that speculative traders added $12.5 million in notional leverage to defend the $135 price support level.
Solana’s funding rate also turned positive to reach 0.0027% over an 8-hour time frame, showing that bulls are paying higher fees to keep bullish positions open.
The long/short ratio, close to 1.0, confirms that most of these new positions came from bull market participants covering aggressively rather than an accumulation of short positions.
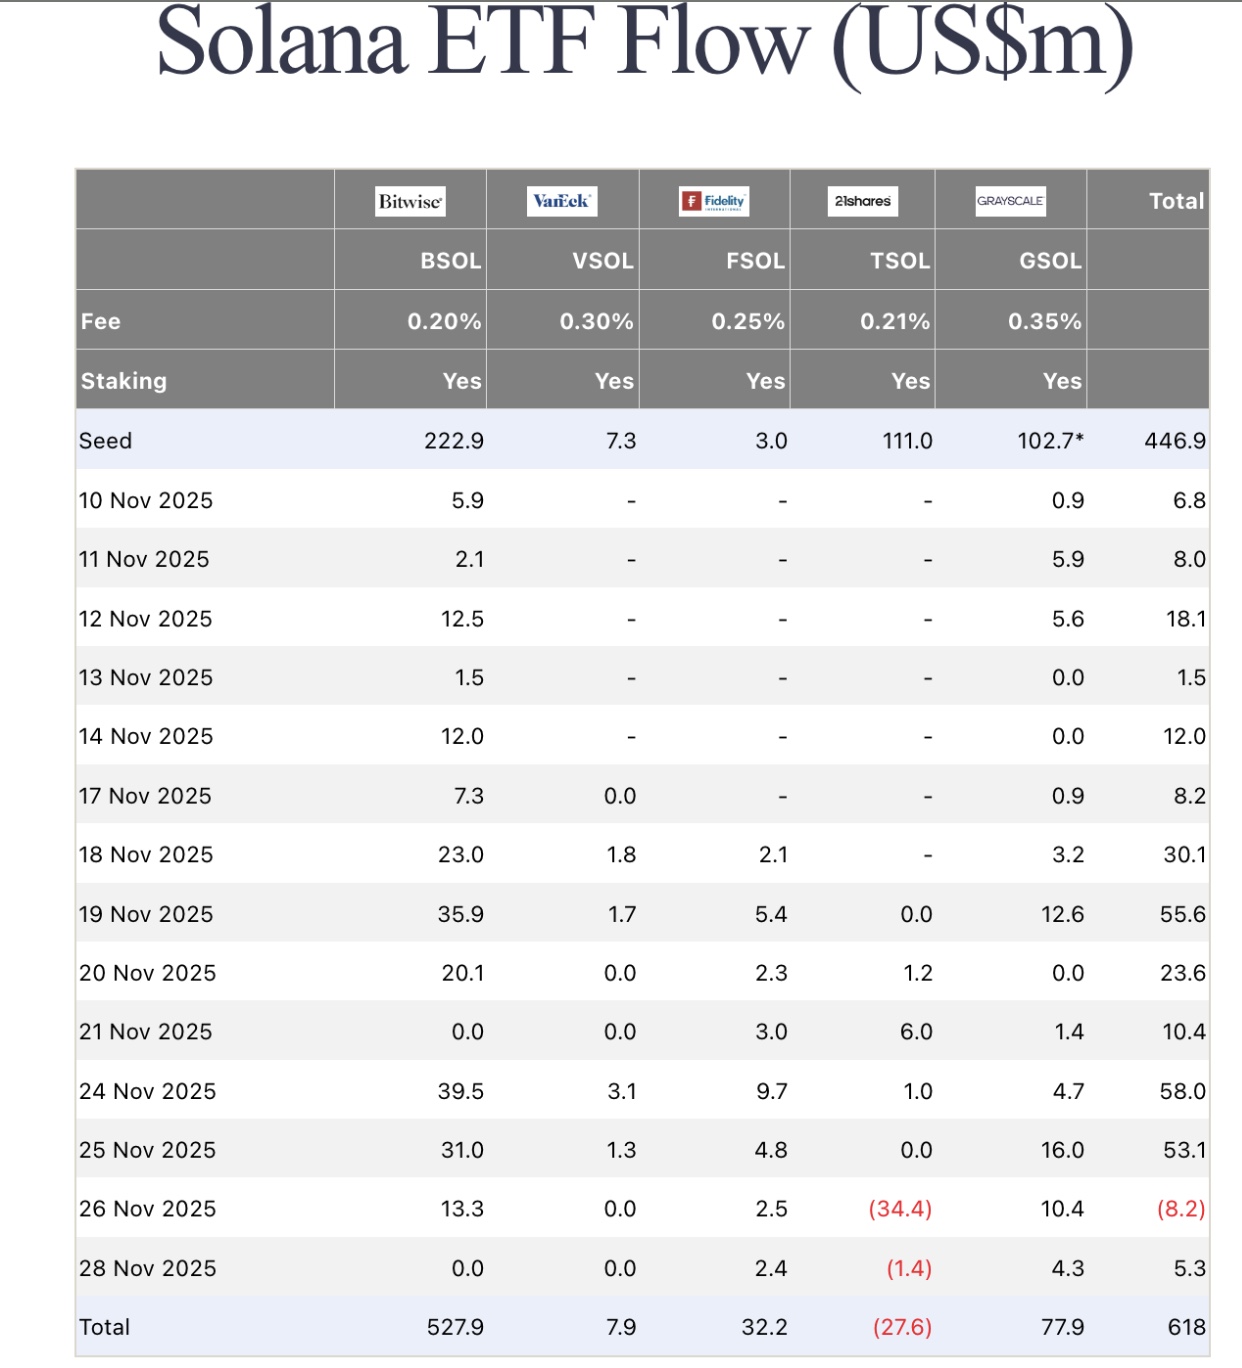
Solana ETF Flow as of November 28, 2025 | Source: FarsideInvestors
ETF flows have also reinforced the resilience narrative. All actively traded Solana ETFs closed the week positively, seeing inflows of $5.3 million on Friday, reversing Thursday’s outflows of $8.3 million that ended a 22-day inflow streak dating back to the SEC approval on February 28. The return to net inflows suggests traders expect the 21Shares ETF’s headwinds to fade quickly.
Solana Price Prediction: Can bulls confirm falling wedge breakout towards $220?
Solana continues to trade inside a well-defined descending wedge, a bullish reversal pattern formed when descending support and resistance lines converge. A breakout typically occurs when price closes above the upper trendline, often triggering a rally proportional to the height of the wedge.
Solana is currently trading between $135 and $136, between the midline and lower KC band. A positive MACD crossover reflects an improving trend strength and increasing upside probability.
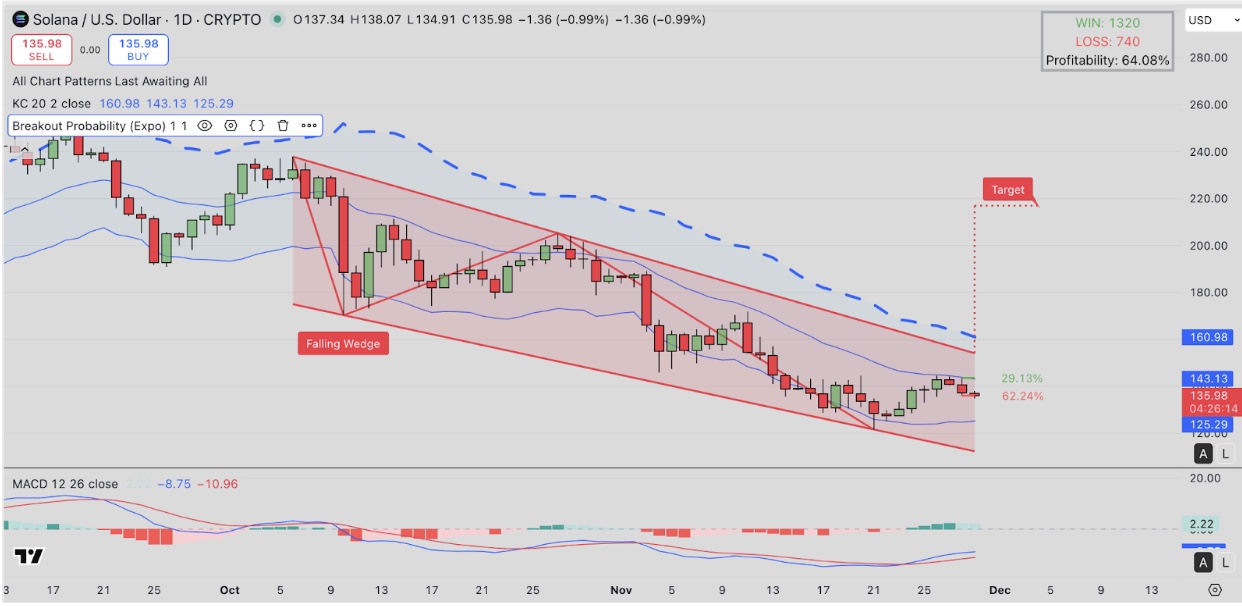
Solana (SOL) Technical Price Analysis | Source: TradingView
The descending wedge projection on the daily SOLUSD price chart shows an upside potential of 62.24%, targeting the $220 level, if a confirmed breakout occurs above the wedge’s upper boundary, near $150. Conversely, the downside risk is marked at 29.13%, referring to a potential retest of wedged support near $120.
On the upside, a daily close above $143.10 followed by a break above $150 to $152 would complete the descending wedge structure. If that happens, Solana could accelerate toward the measured $200-$220 move target.
following
Disclaimer: Coinspeaker is committed to providing unbiased and transparent reporting. This article is intended to provide accurate and current information, but should not be considered financial or investment advice. Because market conditions can change quickly, we encourage you to verify the information for yourself and consult a professional before making any decisions based on this content.

Ibrahim Ajibade is a seasoned research analyst with experience supporting various Web3 startups and financial organizations. He completed his undergraduate degree in Economics and is currently studying for a Master’s degree in Blockchain and Distributed Ledger technologies at the University of Malta.
Ibrahim Ajibade on LinkedIn